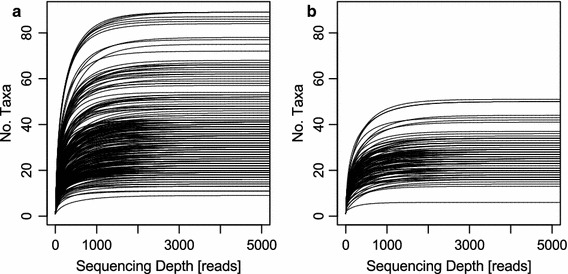
Figure 2.

Species accumulation curves. a Osmia bicornis samples; b Osmia truncorum samples. The x-axis was limited to 5,000 reads as the saturation of all samples was below this threshold. The y-axis was limited to 90 taxa in both plots to obtain the same scale. Taxa accounting for less than 0.1% of total sample reads were excluded.
