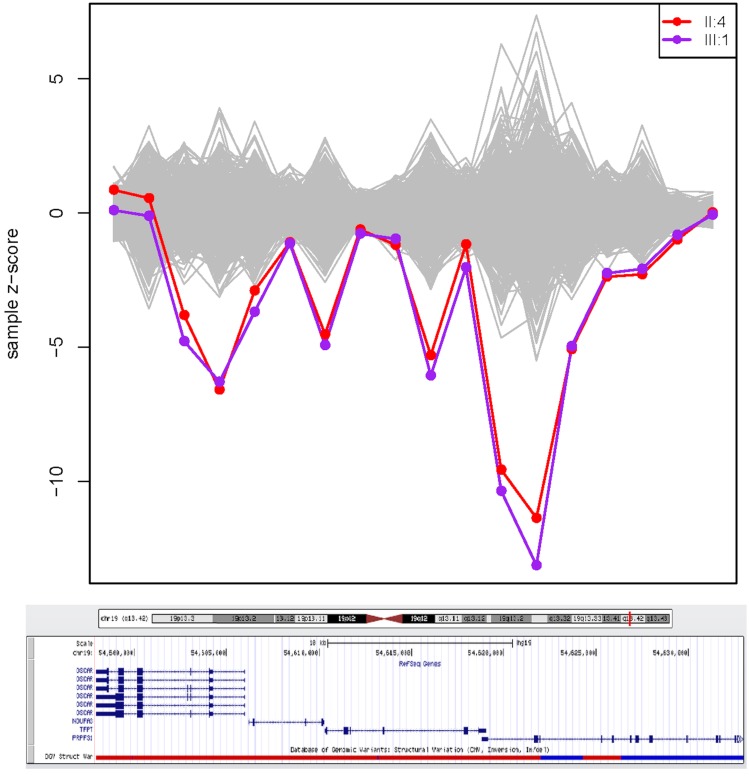
Fig 1. Region predicted by XHMM to harbor a heterozygous deletion.
The x-axis represents the genome locus, with the genes and exons included in the algorithm, and the y-axis is the computed Z-score of PCA normalized read depth where positive values indicate predicted duplication and negative values deletion. The two affected individuals from family RP-0777 are highlighted with colors red (member II:4) and purple (member III:1) while grey lines represent the 663 control individuals used. Each point indicates a region containing an exon and they are paired with the corresponding exon/gene in a display of the region from the UCSC Genome Browser (http://genome.ucsc.edu/cgi-bin/hgGateway). On the left side of the UCSC Genome Browser track, the genes involved in the deletion are represented. From left to right, the genes/exons illustrated are exons 5 to 1 of the OSCAR gene, the entire genes NUDFA3 and TFPT (4 and 6 exons, respectively), and exons 1 to 12 of PRPF31.

