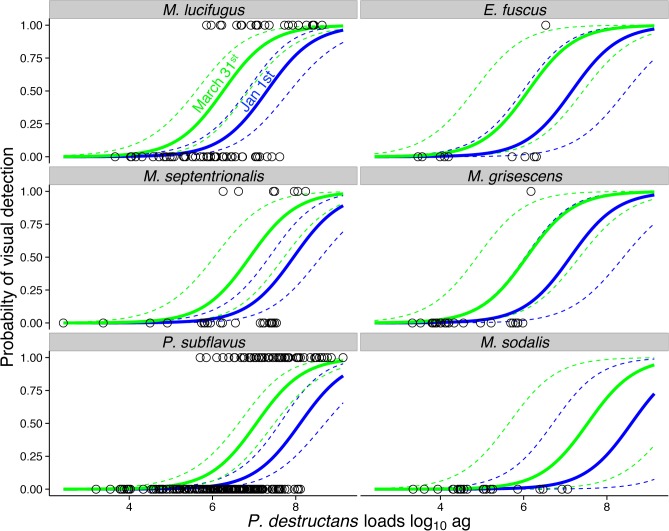
Fig 2. Visual detectability of Pseudogymnoascus destructans on bats compared to fungal loads.
Solid lines show predicted relationships from the best-fit model (Table 2) and dashed lines show the 95% confidence bands for early (January 1st; blue lines) and late (March 31st; green lines) sampling dates. Individual circles are bats that tested positive for P. destructans by qPCR and did (y-axis value of 1) or did not (0) have visible evidence of P. destructans.

