
Fig. 4.
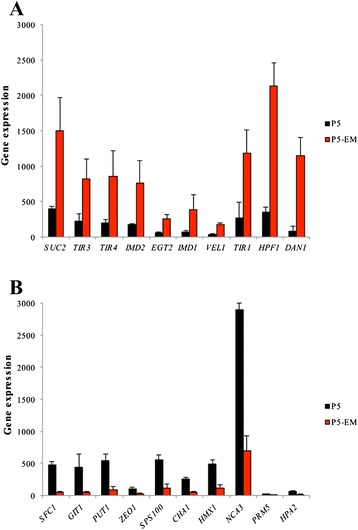
Major differences of transcriptomics analysis. The 10 most up-regulated (a) and down-regulated (b) genes in P5-EM (red bars) compared to P5 (black bars) during the fermentation at 12 °C
Official websites use .gov
A
.gov website belongs to an official
government organization in the United States.
Secure .gov websites use HTTPS
A lock (
) or https:// means you've safely
connected to the .gov website. Share sensitive
information only on official, secure websites.
Major differences of transcriptomics analysis. The 10 most up-regulated (a) and down-regulated (b) genes in P5-EM (red bars) compared to P5 (black bars) during the fermentation at 12 °C