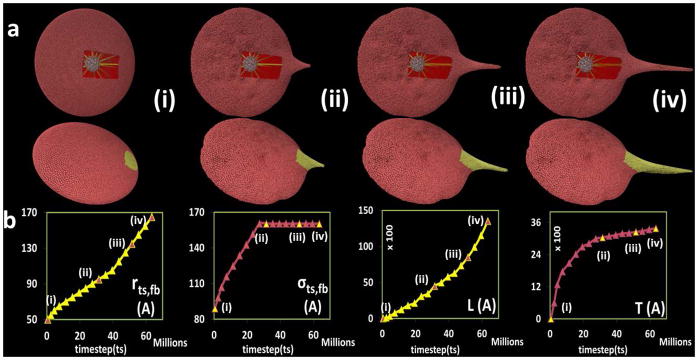
Figure 5.

Evolving filopod formation of the platelet model. (a) The first row shows the filamentous core (white), filament bundles (yellow) and cytoplasm (red) components inside the platelet; second row is the complete platelet membrane. (b) Plot for model parameters r_(ts,fb),σ_(ts,fb) and output measurements of filopod L,T with respect to timestep ts in the simulation. The Y-axis units are Angstroms, X-axis units are number of simulation steps.
