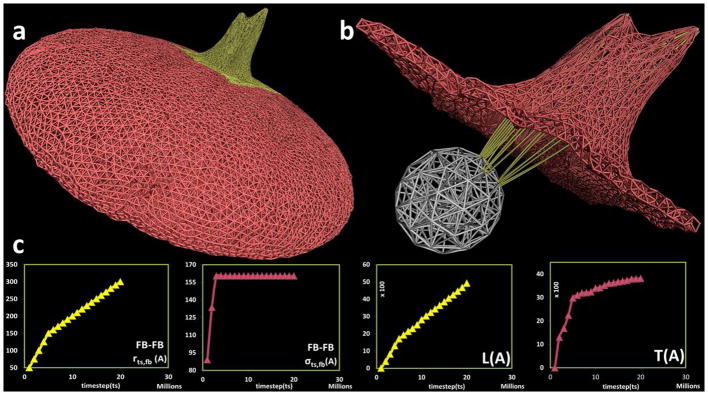
Figure 6.

Filopod formation on the platelet model using three filament bundles in close proximity. (a) Complete platelet membrane after filopod formation with (b) filamentous core (white) and filament bundles (yellow) components inside the platelet. (c) Plot for model parameters r_(ts,fb),σ_(ts,fb) and output measurements of filopod L,T with respect to timestep ts in the simulation. The Y-axis units are Angstroms, X-axis units are number of simulation steps.
