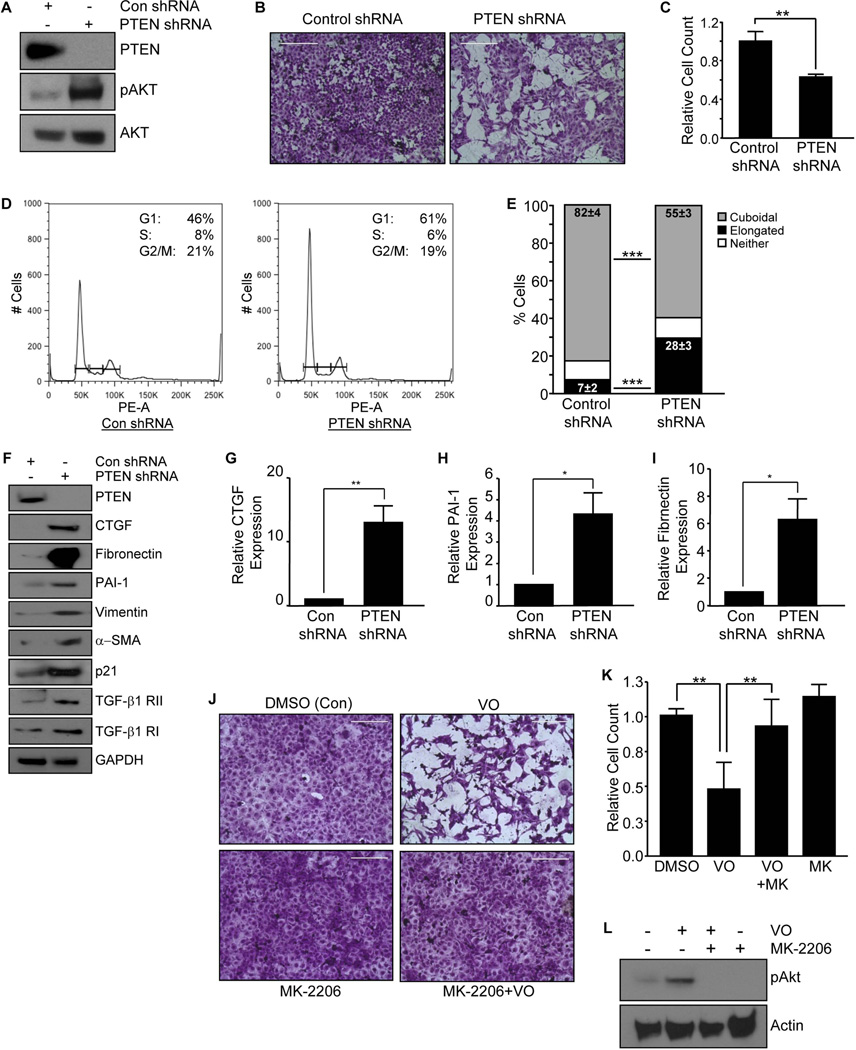
Figure 3. Gene silencing and inhibition of PTEN expression in HK-2 tubular epithelial cells promotes G1 arrest, morphological transition and profibrotic gene expression.
PTEN and control (Con) shRNA expressing cultures were assessed for PTEN, pAkt and total Akt expression levels by western analysis (A). Crystal Violet staining of equally-seeded HK-2 cells with stable PTEN knockdown or control shRNA in complete media for 3–5 days (B). Cell number for each experimental condition was determined in triplicate (mean±s.d) and is shown in (C), setting control shRNA as 1. **P < 0.01. Propidium iodide staining followed by flow analysis of PTEN and Con shRNA expressing cells grown in complete media for 2–3 days was utilized to assess cell cycle distribution (D). Insets in each histogram highlight the percentages of G1, S, and G2/M phase cells for Con shRNA or PTEN-knockdown cultures. The histogram illustrates the relative changes in morphology (e.g., elongated [i.e., fibroblastoid], cuboidal or neither) in PTEN or control (Con) shRNA expressing cells after 3–5 days as a percentage of total population (mean±s.d) (E). ***P < 0.001 for both elongated and cuboidal morphology changes. Sub-confluent Con and PTEN shRNA expressing cell cultures were maintained in low serum (0.1%) for 3–5 days and extracted lysates analysed by western blotting with antibodies to CTGF (F&G), PAI-1 (F&H), fibronectin (F&I), α–SMA, vimentin, p21, TGF-β1 RI and RII and GAPDH (a loading control) (F). The histogram (mean±s.d) depicts a summary of three independent assessments of the relative expression of CTGF (F), PAI-1 (H) and fibronectin (I) in PTEN depleted cells setting the levels of control shRNA cells as 1. *P < 0.05, **P < 0.01. VO-OHpic trihydrate (VO) treatment was utilized to inhibit PTEN expression in HK-2 cells. Crystal Violet staining of VO-treated (1µM for 48 hours) or DMSO control HK-2 cells with or without Akt inhibitor pretreatment (J). Scale= 200µM. Cell count analysis for each experimental condition in triplicate (mean±s.d) is shown in (K) setting DMSO control as 1. *P < 0.05, **P < 0.01, as indicated between groups. Western analysis of DMSO/control, Akt inhibitor-MK-2206 (1nM)-, VO- and MK-2206+VO-treated cultures for pAKT and actin expression is presented in (L). MK=MK-2206.

