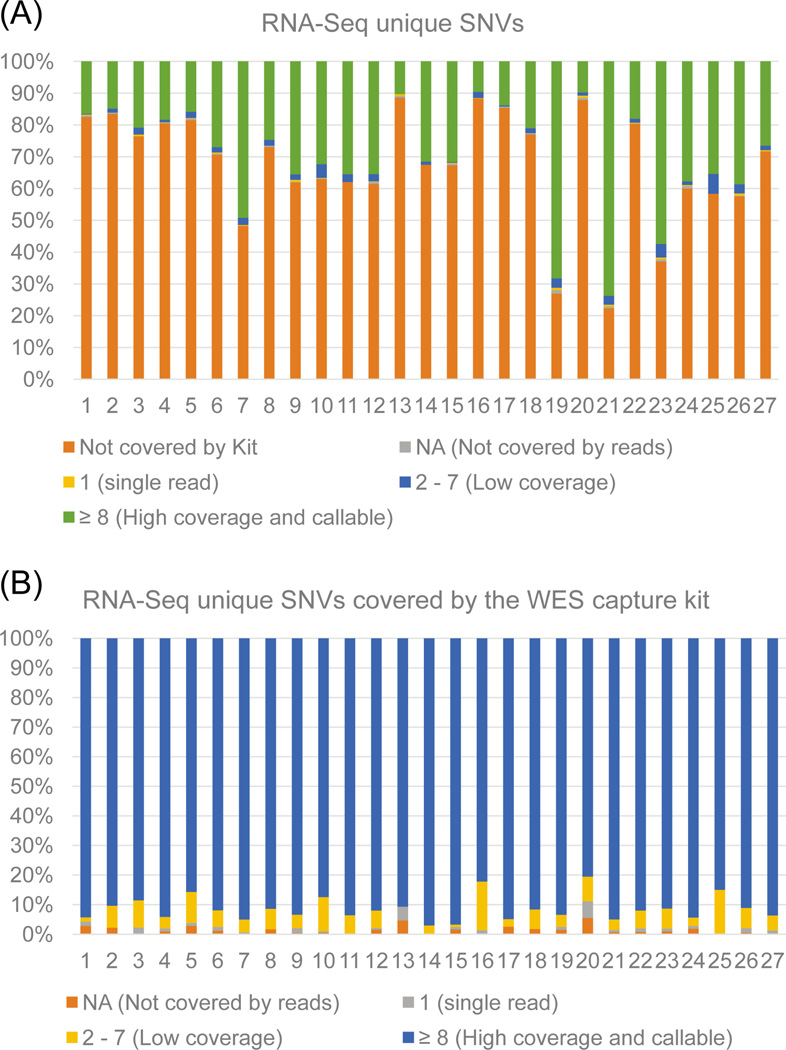
Fig. 4.
RNA-Seq unique SNVs not covered by the WES kit and coverage levels. (A) Barplot shows the percentage of RNA-Seq unique SNVs within each sample that are not covered by the WES capture kit. Also included are VarScan2 read count values for covered positions. Figure 4A shows that most SNVs are not covered by the WES kit. Here, ‘not covered by kit’ represents RNA-Seq SNVs outside of the capture kit region, read counts values represented by NA, 1, 2 – 7, and ≥ 8. (B) Barplot containing VarScan2 read counts values for only the positions covered by the WES kit. Most SNVs covered by the WES kit have high coverage. Read counts values represented by NA, 1, 2 – 7, and ≥ 8.

