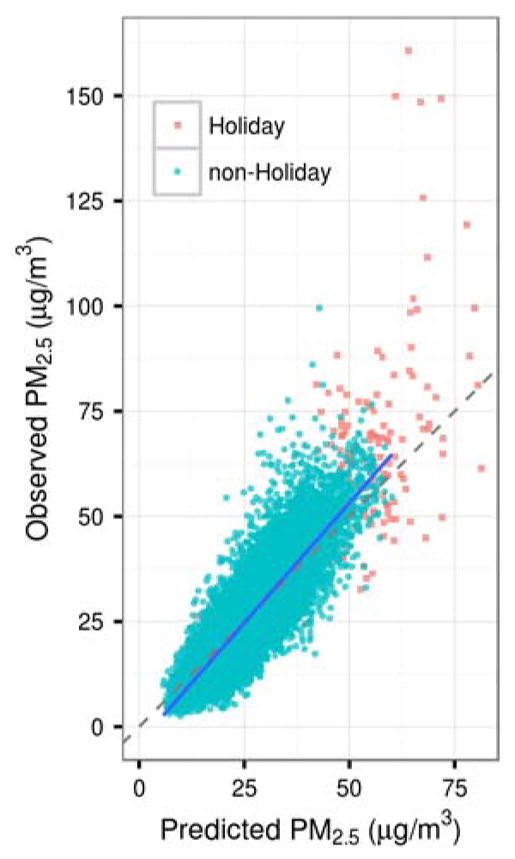
Figure 3.

Cross-validated predictions from the full coverage model versus measurements at the 12 monitoring stations. The blue line is a generalized additive model fit to the subset of points that are not Christmas or New Years. The dashed grey line represents the one-to-one diagonal.
