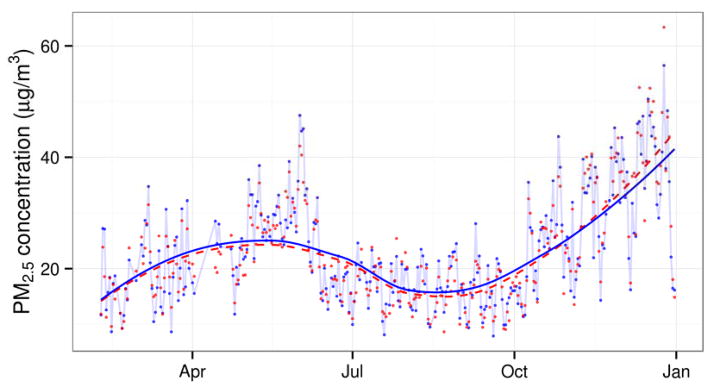
Figure 4.

PM2.5 measurements and cross-validated predictions from the full coverage model for the CAM monitor in 2010. Connected blue points are the daily PM2.5 measurements while red points are the full coverage predictions. Smoothed curves are loess regression lines for measurements (solid) and predictions (dashed).
