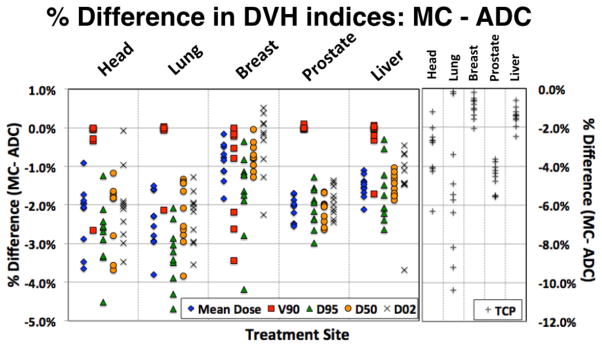
Figure 1.

Summary of the dosimetric analysis: percentage difference for five sites and five dosimetric parameters. DXX is the maximum dose covering XX% of the target volume, V90 is the % of the target volume covered by 90% of the prescribed dose, and TCP is the tumor control probability.
