
Figure 2.
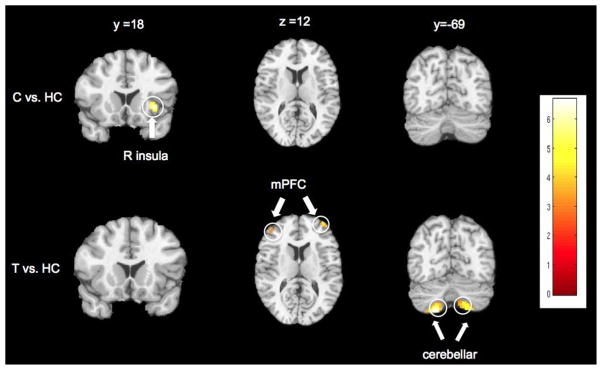
Brain regions showing enhanced functional connectivity strength with the posterior cingulate cortex (PCC) compared to healthy controls (HC). Clusters of significant differences (p < 0.001, cluster-corrected at family-wise error (FWE) of p < 0.05 and k > 40 voxels) are displayed on representative sagittal, coronal, and axial slices overlain on the standard MNI brain. Right side of the brain is depicted on the right side. C = cannabis-dependent individuals who do not smoke tobacco; T = nicotine-dependent, cannabis-naive individuals; R = right; mPFC = medial prefrontal cortex.