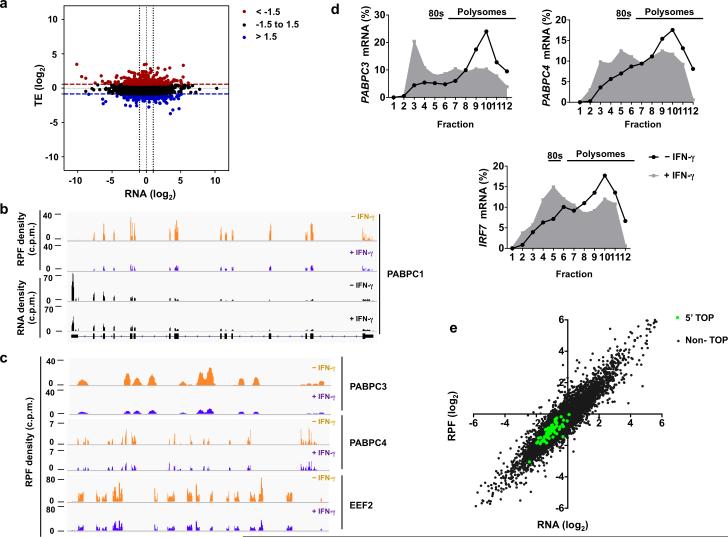
Figure 6. Genome-wide ribosome profiling analysis of IFN-γ-mediated translational regulation in macrophages.
(a) Scatter plot comparing the changes in mRNA abundance (x axis) and translational efficiency (TE) (y axis) in response to IFN-γ; RNA fold change (x axis) = log2( RNAIFN-γ/RNAcontrol); TE fold change (y axis) = log2(TEIFN-γ /TEcontrol); mRNAs with suppressed TE (z-score <−1.5) or induced TE (z-score>1.5) are highlighted in blue or red, respectively. (b) Ribosome-protected fragment (RPF) and RNA-seq read density profiles for PABPC1 in control (tracks 1 and 3) and IFN-γ-primed (tracks 2 and 4) macrophages; data are normalized to total mapped reads in each library. (c) Ribosome-protected fragments (RPF) read density profiles for PABPC3, PABPC4 and EEF2 in control (yellow) and IFN-γ-primed (purple) macrophages; data are normalized to total mapped reads in each library. (d) Polysome shift analysis of PABPC3, PABPC4 and IRF7 mRNA. (e) Scatter plot comparing the changes in mRNA abundance and ribosome footprint frequency; RNA (log2) = log2(RNAIFN-γ/RNAcontrol); RPF (log2) = log2(RPFIFN-γ/RPFcontrol); mRNAs with 5’ TOP elements are highlighted in green; Pearson correlation value (R) was calculated by GraphPrism. R2=0.65 for 65 established 5’ TOP genes; R2=0.86 for Non-TOP genes. Data (a, e) was generated from a merged dataset of two biological replicates, or is representative of two (b-c) or three (d) independent experiments.

