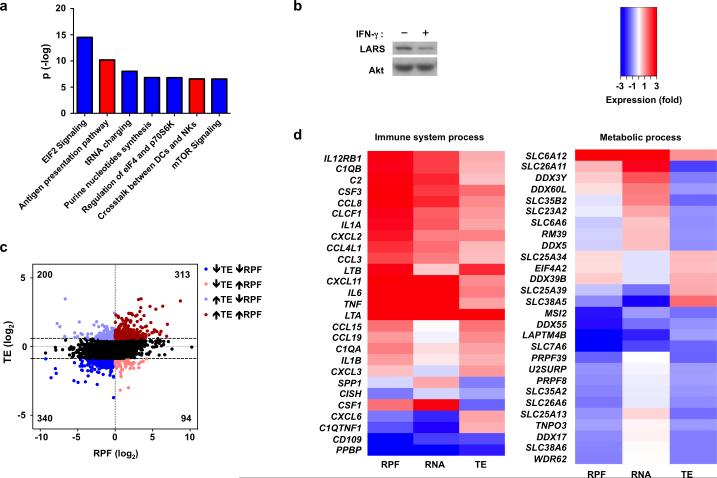
Figure 7. Selective translational inhibition of mRNAs involved in metabolic processes and protein synthesis by IFN-γ.
(a) Ingenuity Pathway Analysis (IPA) of canonical pathways most enriched in sets of genes either up- (red) or down- (blue) regulated by IFN-γ at the level of ribosome footprint frequency (RPF); the y-axis indicates the –log10 (p-value) of each enriched pathway. (b) Immunoblot analysis of LARS in control or IFN-γ-primed macrophages; p38α serves as loading control. Data is representative of three experiments. (c) Scatter plot comparing the changes in ribosome footprint frequency and translational efficiency; RPF (log2) = log2(RPFIFN-γ/RPFcontrol); TE (log2) = log2(TEIFN-γ /TEcontrol); mRNAs with decreased TE (log2TE < −0.856) and decreased RPF (log2RPF < 0) are highlighted in dark blue; mRNAs with decreased TE (log2TE < −0.856) and increased RPF (log2RPF > 0) in light red; mRNAs with increased TE (log2TE > 0.578) and increased RPF (log2RPF > 0) in dark red; mRNAs with increased TE (log2TE > 0.578) and decreased RPF (log2RPF < 0) in light blue. (d) Heat map showing changes in RPF, RNA and TE of representative immune and metabolic process genes selected from gene sets identified by Gene Ontology (GO) analysis of translationally-regulated genes. GO analysis and entire enriched gene sets are shown in Supplementary Fig.7 and Supplementary Tables 1 and 2. Data (a, c, d) was generated from merged dataset of two biological replicates.

