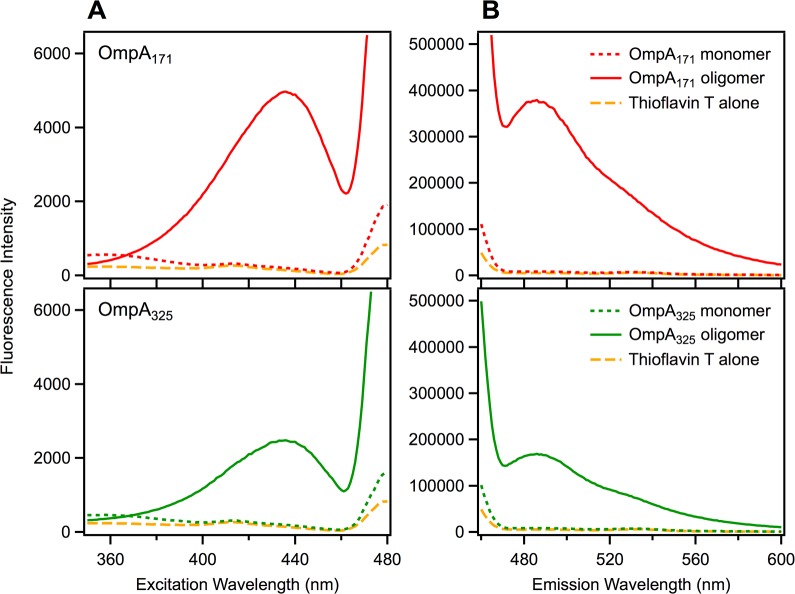
Fig 3. Thioflavin T binding measured by fluorescence.
(A) Excitation spectra for 3 μM Thioflavin T in the presence of OmpA171 (top, red) or OmpA325 (bottom, green). Dotted lines correspond to conditions that maintain the monomeric state for both constructs (1 μM protein in 600 mM urea, 20 mM Tris, pH 8). Solid lines correspond to conditions that promote self-association for both constructs (3 μM protein in 300 mM urea, 20 mM Tris, pH 8, with a 16 h incubation). The spectrum for Thioflavin T alone is shown as a dashed gold line. Emission was collected at 482 nm. (B) Emission spectra for the same mixtures, with excitation at 450 nm.

