Figure 7.
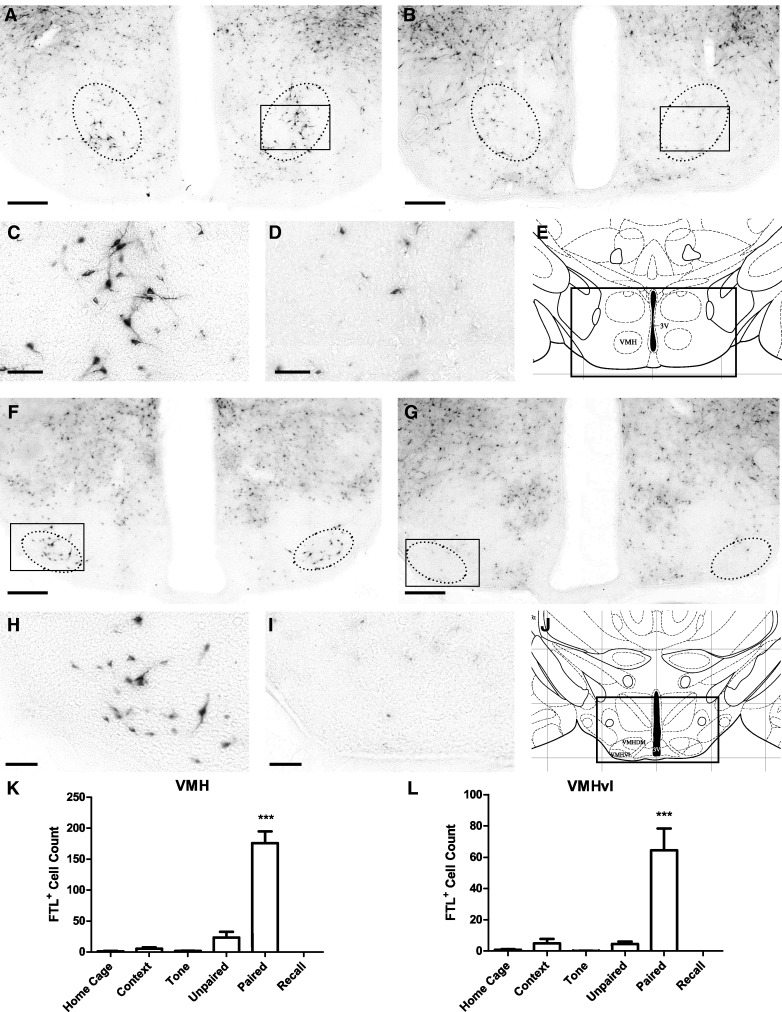
Learning-specific FTL+ neurons in the VMH and VMHvl following auditory fear conditioning. (A) Bright-field photograph of hypothalamic region at bregma −1.2 mm showing FTL+ neurons in the VMH in a Paired mouse. The solid box encloses the area shown in high power in C. Neurons were counted in region encompassed by dotted line. (B) Comparative photograph of Unpaired mouse. (C) High-power view of FTL+ neurons in Paired VMH. (D) High-power view of Unpaired VMH boxed in B. (E) Plate from Mouse Brain Atlas (Franklin and Paxinos 2008) highlighting the region shown in A and B. (F) Bright-field photograph of hypothalamic region at bregma −1.8 mm from a Paired mouse. The solid box encloses the area shown in high power in H. Neurons were counted in region encompassed by dotted line. (G) Comparative image from an Unpaired mouse. (H) High-power view of FTL+ neurons in Paired VMHvl. (I) High-power view of VMHvl from an Unpaired mouse boxed in G. (J) Plate from Mouse Brain Atlas (Franklin and Paxinos 2008) containing the region shown in F and G. (K) FTL+ neuron counts of rostral VMH region in each group of trained mice. Significantly more FTL+ neurons were present in rostral VMH from Paired mice compared with controls. (L) FTL+ neuron counts of caudal VMHvl region in each group of trained mice. There were significantly more FTL+ neurons in Paired mouse VMHvl compared with controls. Numbers are expressed as mean ± SEM. (***) P < 0.001. Scale bar, 250 µm (A, B, F, G), 50 µm (C, D, H, I).

