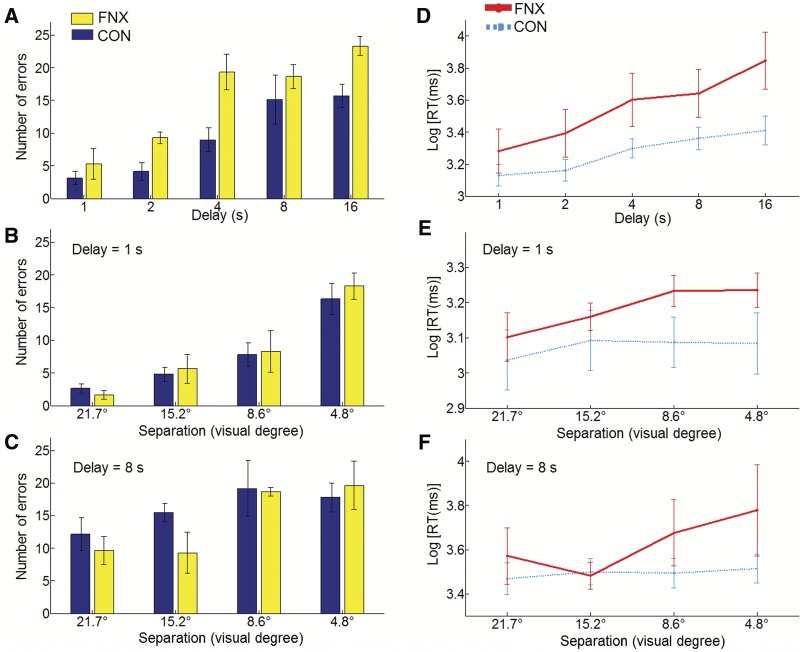
Figure 2.
Recognition performance and response time for fornix transected (FNX) and control (CON) groups. (A–C) Recognition performance expressed as number of errors by levels of conditions in Exp. 1 (A), Exp. 2a (B), and Exp. 2b (C). (D–F) Response time (RT) expressed as logarithmically transformed RT by levels of conditions in Exp. 1 (E), Exp. 2a (D), and Exp. 2b (F). The log-RT plots include both correct and error trials. Error bars depict the standard error of the means.

