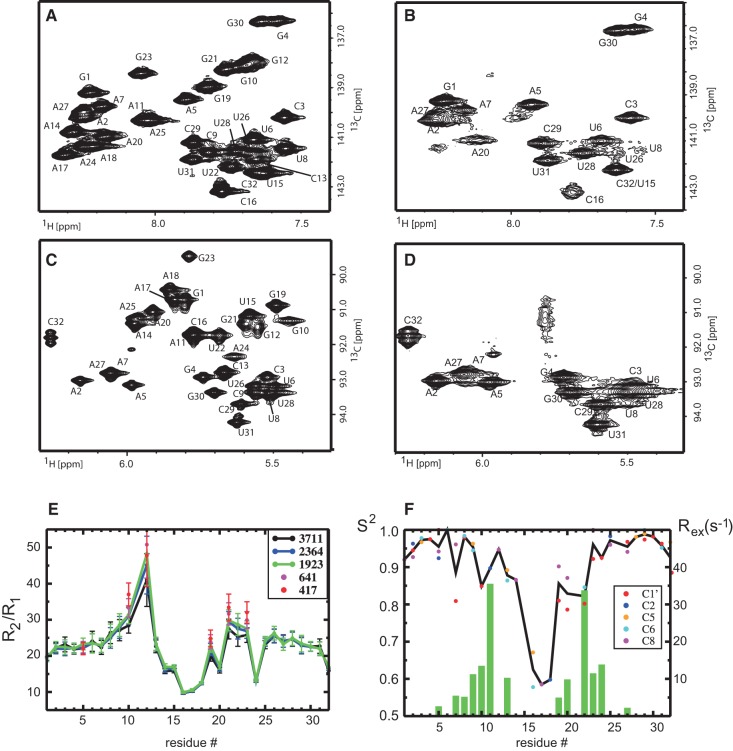
FIGURE 2.
(A,C) 13C–1H correlation of the base (A) and ribose (C) region of the SOLE RNA at 308 K. All resonances are visible in the spectra. (B,D) 13C–1H correlation of the base (B) and ribose (D) region of the SOLE RNA at 283 K. Only the resonances of the first 5–6 bp from the termini are visible. All other resonances are exchange-broadened beyond detection. (E) Ratio of transverse and longitudinal relaxation rates of C6/C8 atoms in dependence of the radio frequency field strength B1 of the R1ρ spinlock pulse (given in Hertz in the inset). For the two smallest B1 fields, only residues with resonance offsets smaller than 76 Hz are shown. (F) Order parameters S2 (dots) and exchange contributions Rex (bars) characterizing the internal motions of the RNA. The green bars show the Rex contribution averaged over all carbon atoms of the corresponding residue. The order parameters are indicated by colored dots, differentiating the different carbon atoms. The black line connects the S2 values averaged of all carbons of each residue.

