
FIGURE 5.
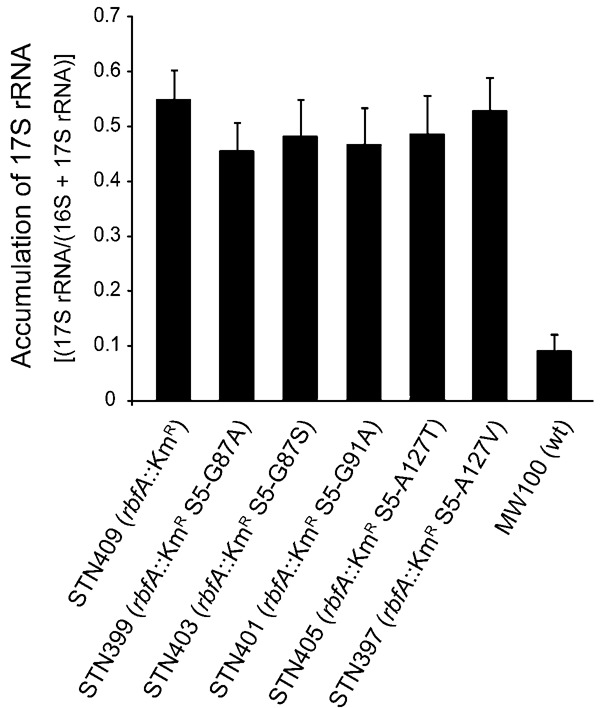
16S rRNA processing in an rbfA::KmR mutant and its derivatives expressing variants of r-protein S5 containing different amino acid substitutions. The graph shows the average accumulation of 17S rRNA to total (16S plus 17S) in total cellular RNA. The error bars represent the standard error of the mean.