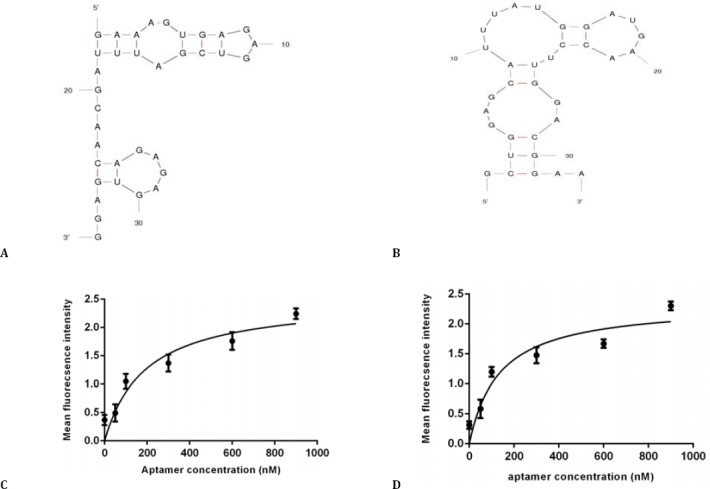
Figure 3.

Software simulated secondary structure of TSA12 (A) and TSA14 (B) aptamers, binding curve of TSA12 aptamer (C) and TSA14 aptamer (D) with TUBO cells. Cells were incubated with varying concentrations of Cy5-labeled aptamer and unselected library in triplicate. Mean fluorescence intensity of each concentration was determined. The mean fluorescence intensity of the unselected library (background binding) was subtracted from the mean fluorescence intensity of corresponding aptamer. Using Prism, the apparent dissociation constant (Kd) of aptamer-cell interaction was obtained by fitting the dependence of fluorescence intensity of specific binding on the concentration of aptamers to the one-site saturation equation Y= Bmax X/(Kd + X)
