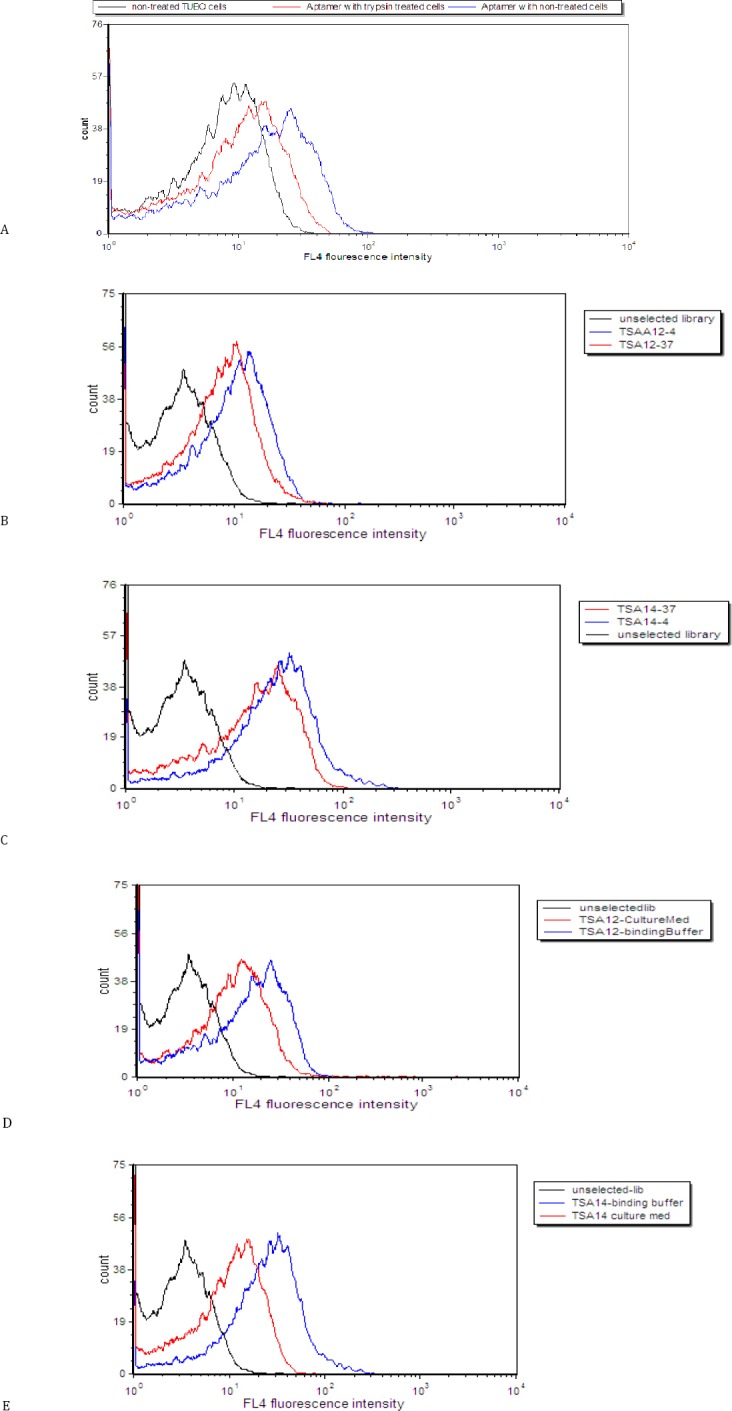
Figure 4.

Effect of trypsin treatment on binding of aptamer to TUBO cells. Binding of unselected library to untreated cells (black histogram), binding of TSA14 aptamer to trypsin-treated cells (red histogram) and binding of TSA14 aptamer to untreated cells (blue histogram) (A). Assessment of the binding of TSA12 (B) and TSA14 (C) at 37 °C and 4 °C. Black (unselected library); blue (binding at 4°C) and red (binding at 37 °C). Assessment of the binding of TSA12 (D) and TSA14 (E) aptamers in culture medium. Black (unselected library); blue (binding in buffer medium) and red (binding in culture medium with FBS)
