Figure 4.

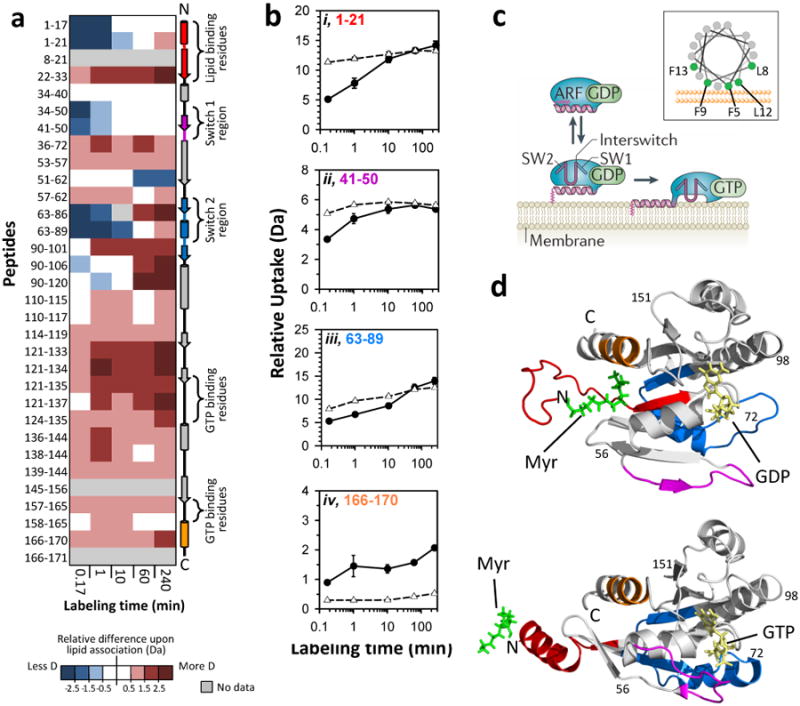
Effects of monolayer association on myristoylated Arf-1. (A) Difference map comparing myrArf-1 HX in the trough (monolayer associated) versus myrArf-1 HX in solution. Deuterium levels for the peptides indicated at the left were obtained from triplicate experiments (data in FIGURE S3). The average amount of deuterium after HX in the trough (monolayer associated) was subtracted from the average amount of deuterium for HX in solution and the value colored (positive values in reds, negative values in blues, as indicated). Secondary structural elements in myrArf-1 are displayed on the right. (B) Deuterium incorporation in four selected myrArf-1 peptides for monolayer associated (-●-) HX and solution (-Δ-) HX. The residues of each peptide are colored to match colored secondary structural elements in panel A. Error bars represent the spread of triplicate measurements. (C) Cartoon model (from Ref. 49) showing the reversible association of myrArf-1*GDP with membranes via myristoylated N-terminal helix prior to nucleotide exchange. A helical wheel of this region is shown in the inset, with the membrane interacting residues highlighted in green. Adapted with permission from Macmillan Publishers Ltd, Ref. 49, Copyright 2011. (D) Structural location in myrArf-1*GDP (PDB:2K5U33) and myrArf-1*GTP (PDB:2KSQ51) of peptides highlighted and color coded (red, pink, blue, orange) in panels A and B. The myristoyl moiety, bound nucleotide and switch regions are indicated.
