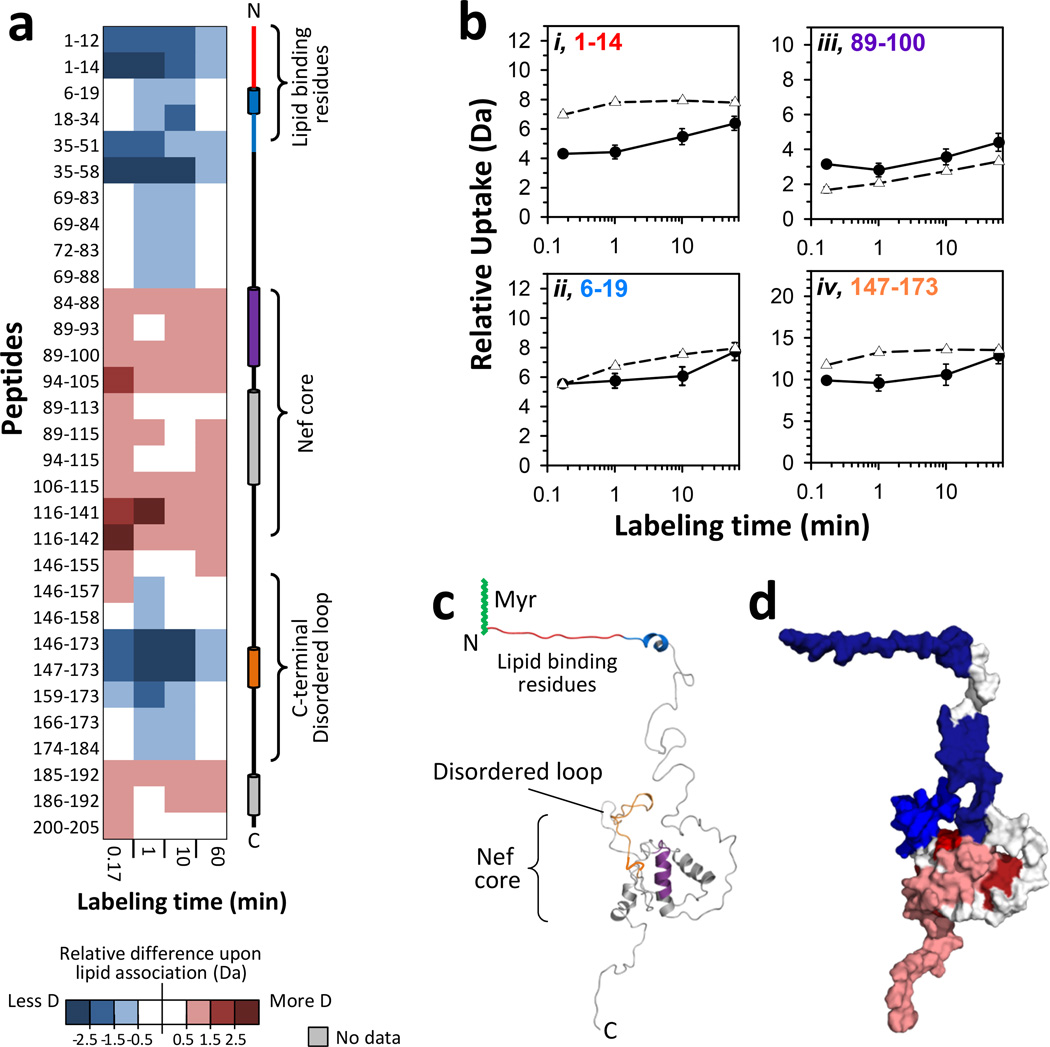
Figure 2.
Effects of monolayer association on myristoylated Nef. All results were obtained with a monolayer pressure of 20 mN/m. (a) Difference map comparing monolayer-associated myrNef HX versus myrNef HX in solution. Deuterium levels for the peptides indicated at the left were obtained from triplicate experiments (data in FIGURE S2). The average amount of deuterium for HX in solution was subtracted from the average amount of deuterium after HX in the trough (monolayer associated) and the value colored (positive values in reds, negative values in blues, as indicated – i.e. blue: less deuterium when with lipid, red: more deuterium when with lipid). Secondary structure elements in myrNef are displayed on the right. (b) Deuterium incorporation in four selected myrNef peptides for monolayer associated (-●-) HX and solution (-Δ-) HX. Error bars represent the spread of triplicate measurements. The residue numbers of each peptide are colored (red, blue, purple, orange) to match the colored secondary structure elements at the right in panel a. (c) Structural locations of peptides in panel B on the model of Nef which was first reported in 13 and here adapted from5. (d) Space filling model illustrating regions of increased HX (red) and decreased HX (blue) in myrNef when bound to the monolayer. These data are for 10 seconds of deuteration and myrNef has been colored according to the scale in panel a. See FIGURE S4 for deuterium levels mapped on the structural model of Nef at other exchange times, both in solution and at the monolayer.

