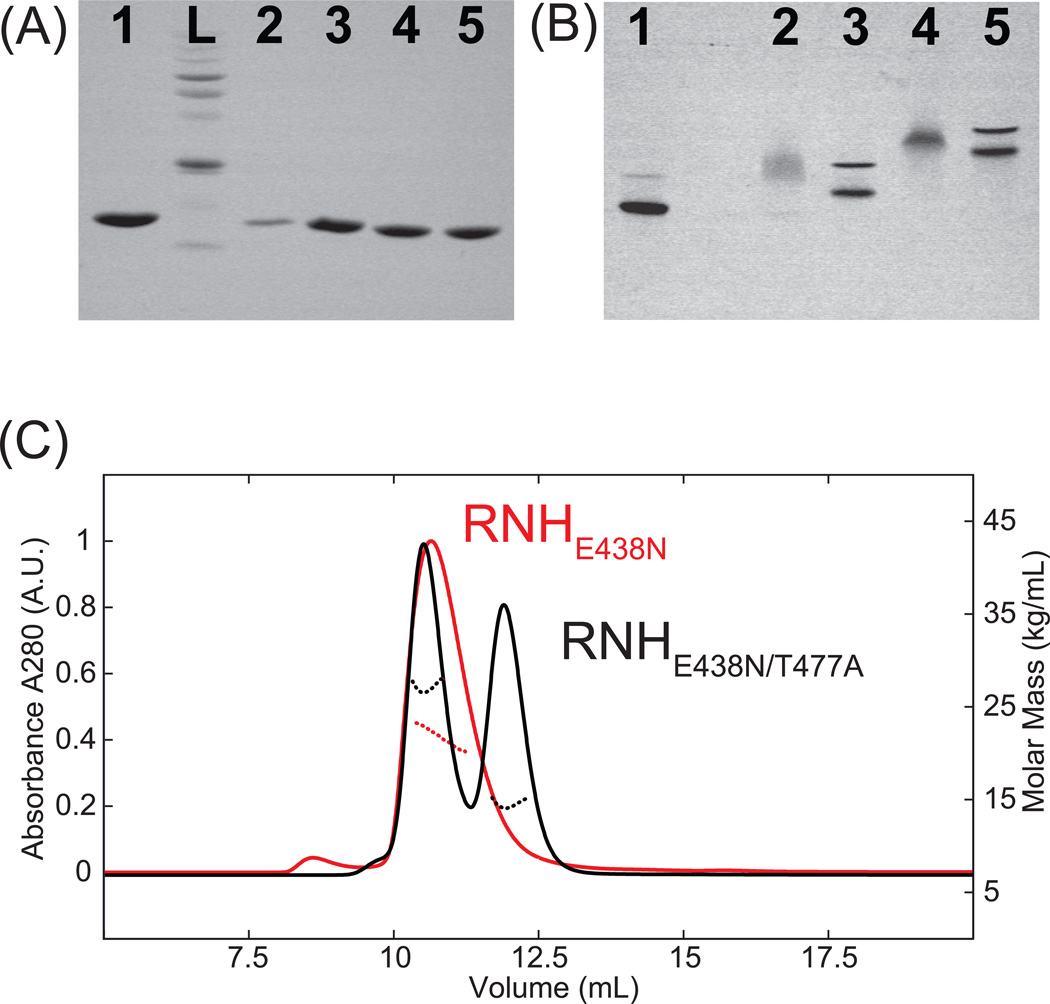
Figure 3.
Gel electrophoresis profiles in (A) denatured and (B) native conditions, and (C) SEC-MALS UV profiles (solid) and molecular mass profiles (dashed) of RNHE438N (red) and RNHE438N/T477A (black). In (A), L indicates a molecular weight size marker. In (A) and (B), Lane 1: WT RNH, Lane 2: RNHF440A, Lane 3: RNHF440A/T477A, Lane 4: RNHE438N, Lane 5: RNHE438N/T477A. In (C) the average molecular mass of the eluted RNHE438N peak was determined to be 22.1 kDa, and those of the eluted RNHE438N/T477A peaks at 10.5 and 12.1 ml were determined to be 14.88 kDa and 27.25 kDa, respectively.

