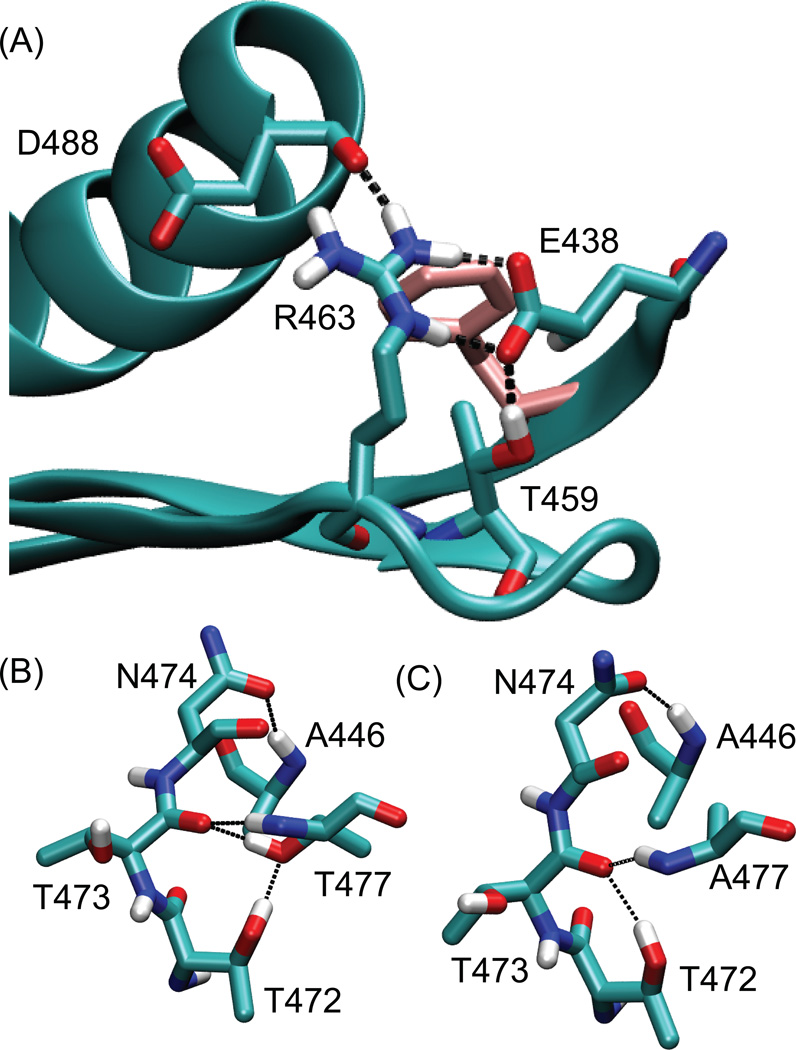
Figure 5.
Hydrogen bonding networks observed in MD simulations. (A) Side chain orientations in the WT RNH around (A) residue 440 (pink), and residue 477 in (B) the WT and (C) the RNHT477A. In (A), dashed lines indicate salt bridge network that involves E438. In (B) and (C), black lines indicate hydrogen bonds that are frequently observed in the WT RNH and the RNHT477A, respectively (see Table 4).

