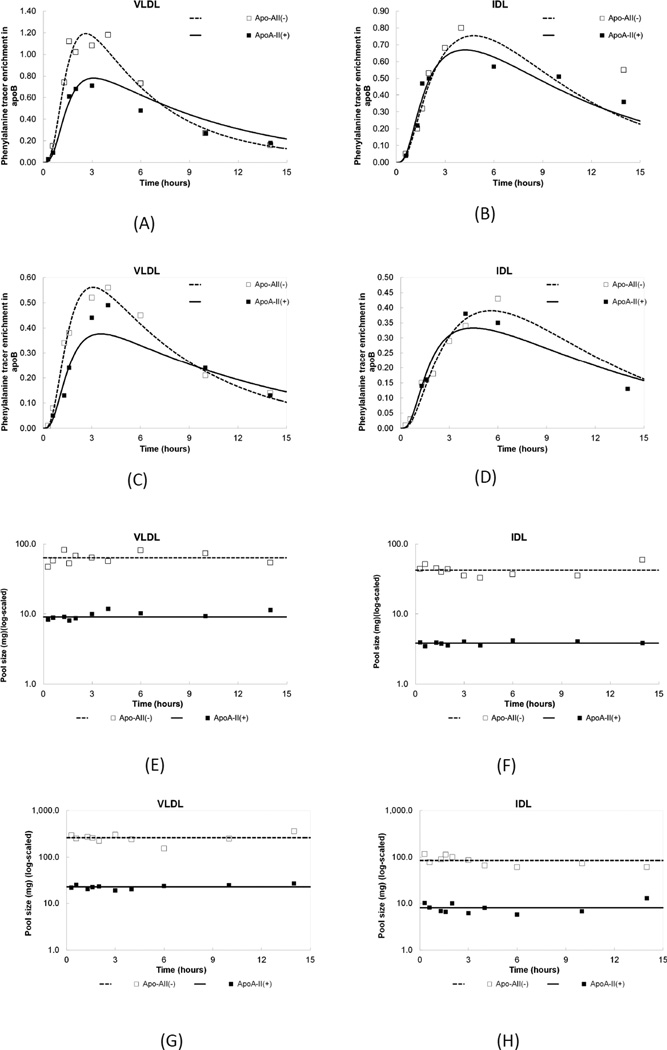
Figure 2.
(A–D) Tracer enrichment of [D5]L-phenylalanine in apoB of VLDL and IDL. Lines represent model derived curves fit to the data points. (A,B) Monounsaturated fat diet and (C,D) Carbohydrate diet. ApoA-II(+) and apoA-II(−): denote lipoproteins that do or do not contain apoA-II, respectively.
(E–H) Measured apoB pool sizes and model-derived fits in VLDL and IDL. Subfractions on a monounsaturated fat (E,F) diet and on a carbohydrate diet. (G,H). ApoA-II(+) and apoA-II(−): denote lipoproteins that do or do not contain apoA-II, respectively.

