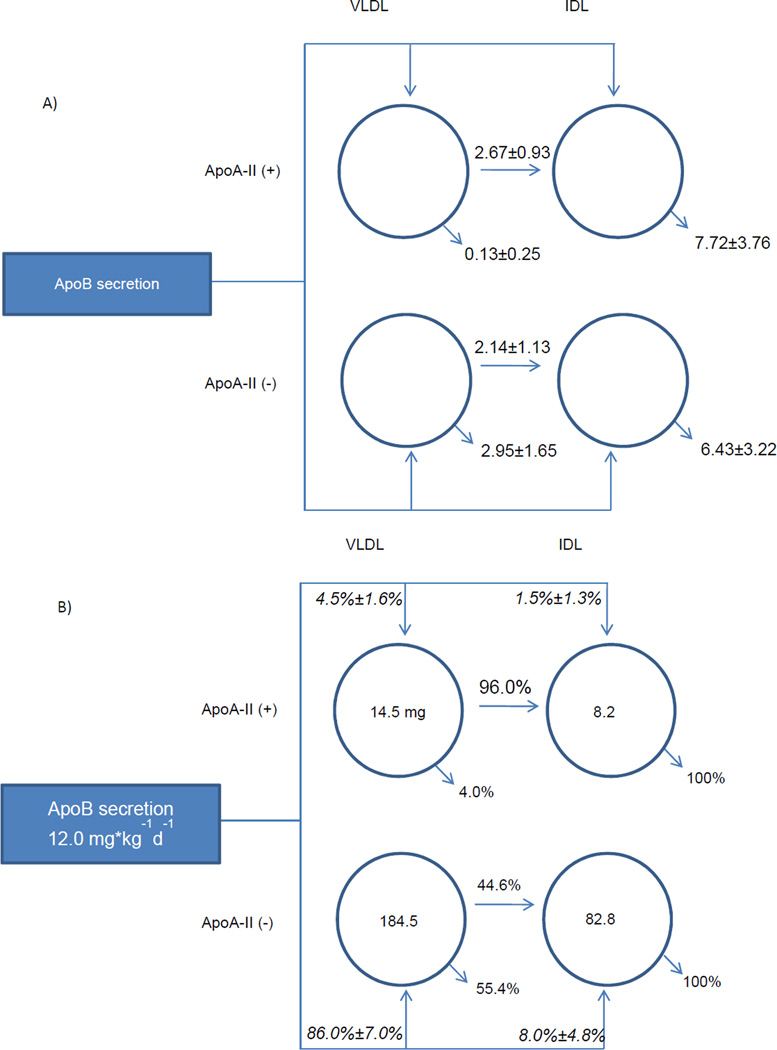
Figure 3.
Average rate flux distributions, pool size (mg), and rate constants (pools/day) of apoB lipoproteins. The rectangular box on the left represents the liver, and arrows out of this box represent direct liver secretion into plasma. The circles represent lipoprotein compartments. The numbers inside the circles indicate average measured pool size. Arrows out of the lipoprotein compartments represent conversion to IDL or removal from plasma. (A) Numbers above or next to the arrows represent average rate constants ± SD. (B) Italicized percentages indicate percentage of total liver secretion into each compartment ± SD. Percentages above or below the arrows indicate the relative proportion of flux out of each compartment. ApoA-II(+) and apoA-II(−): denote lipoproteins that do or do not contain apoA-II, respectively. See Figure 4 and text for statistics.

