
Figure 2.
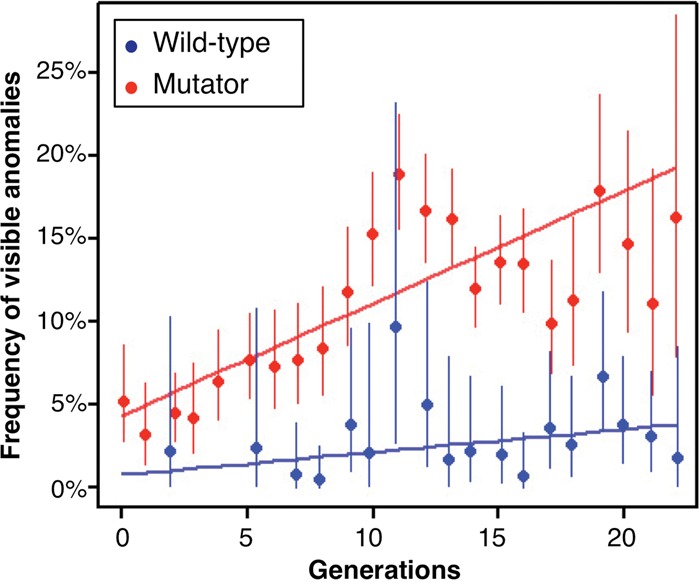
Frequency of visible phenotypic anomalies in breeding lines. Frequency of visible anomalies in each successive generation. Circles indicate observed frequencies with 90% CI, determined by Fisher's exact test. Since fewer than 20 mice were screened in the early-generation (fewer than seven generations) populations of control mice, mean phenotypic frequencies are shown for generations 0–3 and 4–6. Solid lines show the fit with a binomial linear model.