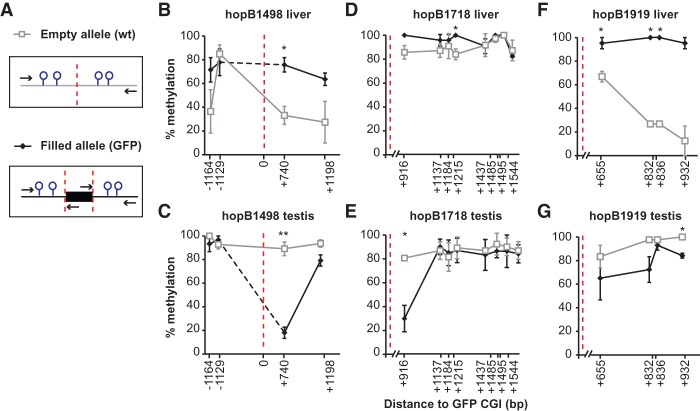
Figure 2.
Comparison of DNA methylation at flanking CpGs between empty and filled alleles. (A) Schematic of the empty versus filled alleles and location of primers (arrows). For panels B–G, open gray rectangles indicate empty alleles, and closed black diamonds represent filled alleles. Error bars represent standard errors of the mean from three biological replicates. (B,C) HopB1498 flanking CpG methylation in adult liver and testis. Corresponding methylation dot plots are in Supplemental Fig. 4. The distance of each CpG to GFP CGI is marked on the x-axis (5′ and 3′ CpGs are indicated by − and + numbers, respectively). The insertion site is designated by a dashed red line. (*) P < 0.05; (**) P < 0.01. (D,E) HopB1718 flanking CpG methylation in adult liver and testis. No CpGs were interrogated upstream of the insertion site as it was CpG poor. (F,G) HopB1919 flanking CpG methylation in adult liver and testis.

