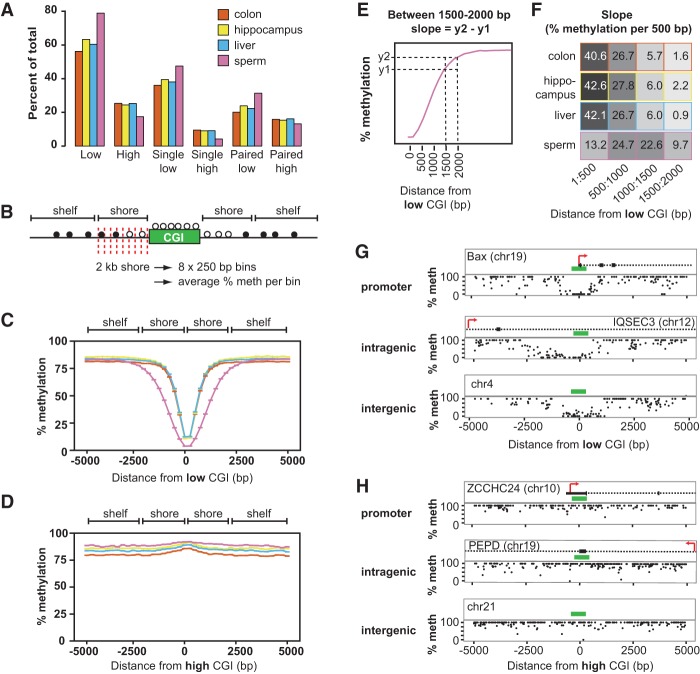
Figure 3.
Hypomethylated CGIs create sloping CGI shores. (A) Percentage of 28,496 CGIs analyzed that fall into each classification (low, high, single low, single high, paired low, paired high) for each tissue analyzed in the repeat-masked human methylome. (B) Schematic of the process used to bin CpGs surrounding a CGI. Briefly, CpGs near each CGI were binned into 250-bp intervals, designated by the red lines, resulting in eight bins across the 2-kb shore. The average methylation for each bin was calculated and then averaged over all CGIs. (C) Average methylation of CpGs in 250-bp bins within 5 kb of single low CGIs (<20% methylation) in colon, hippocampus, liver, and sperm. Tissues are color coded as in A. Each point represents a bin average. Error bars represent standard errors of the mean (error bar heights may not be visible due to large sample sizes). Canonical shore and shelf regions are designated at the top of the graph. Intervals are marked by the starting coordinate, which indicates the distance of interval from the CGI; positive numbers are downstream; negative numbers are upstream of the CGI. (D) Average methylation within 5 kb of single high CGIs (>80% methylation). Tissues are color coded as in A. (E) Calculating the slope (change in % methylation over 500 bp). The average methylation levels at two 10-bp intervals y1 and y2 are used to calculate the slope at different ranges: 1–500, 500–1000, 1000–1500, 1500–2000. (F) Slopes for low CGIs in sperm and somatic tissues as in C. Heat map represents steepness of slope. Supplemental Figure 7A lists slopes for high CGI shores. (G,H) Representative sloping shores of low and high CGIs in three genomic contexts. Genes or genomic location for each example is given within the plot. Black boxes represent exons and 5′ UTRs, dashed lines represent introns, and green boxes designate the location of CGIs. Each dot represents one CpG. Plots do not include CpGs inside a CGI.

