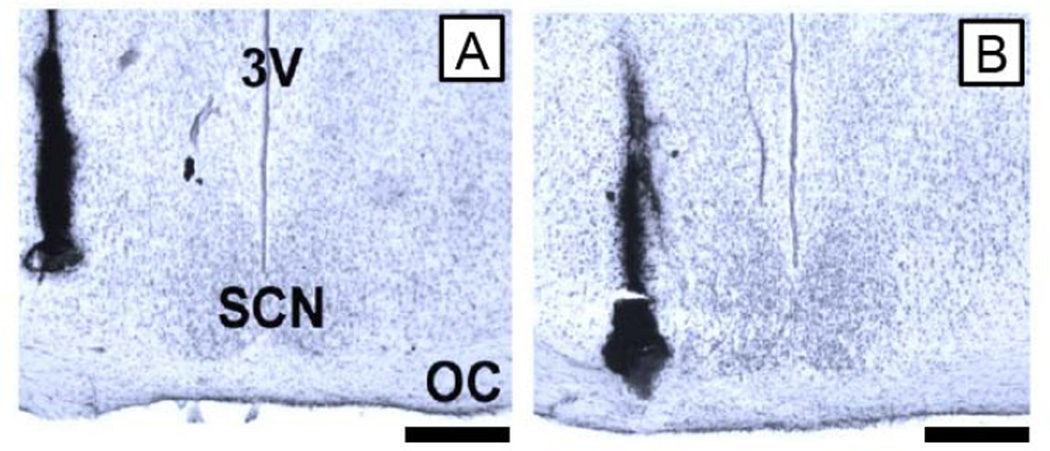
Figure 5.
Illustration of the minimal amount of damage produced by multiple injections into the SCN region as compared to the damage produced by single injections. (A) Photomicrograph from an animal that received a single injection into the SCN region. (B) Photomicrograph from a representative animal that received 8 hourly injections into the SCN region. In each case, a viscous ink was microinjected via the guide cannula to mark the drug injection track; it does not indicate the spread of drugs during experiments. Scale bars are 300µm.

