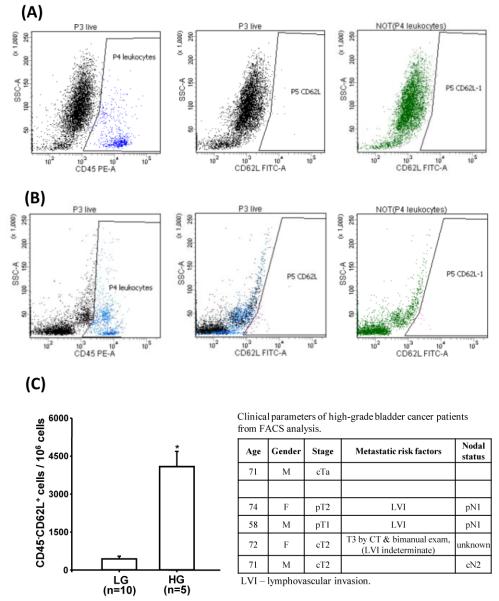
Figure 3.
Representative flow cytometry dot plots of CD45 and CD62L labeled cells in freshly isolated (A) low grade (LG) bladder tumor, and (B) high grade (HG) bladder tumor specimen. (C) Flow cytometric data analysis of normalized live CD45− CD62+ cells per million cells from 15 individual samples (*P<0.001) and associated clinical parameters of HG bladder tumor samples.

