
Fig 1. Generating a sample size 6 tree by extending tip branches of a sample size 5 tree.
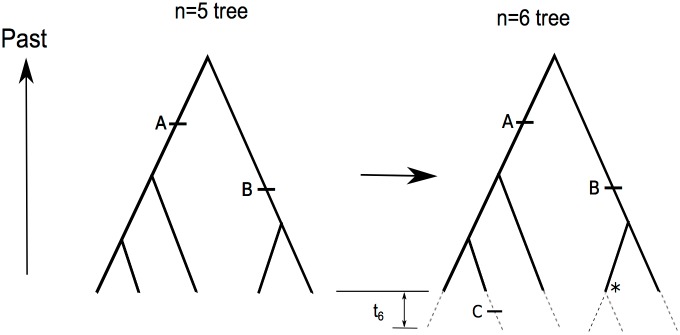
The short horizontal bars indicate mutations, and the asterisk indicates the branch which is split as described in the main text. The dashed lines indicate the branch extensions also described in the main text. The mutation labeled A is a size 3 mutation on both the (n = 5)-tree and the (n = 6)-tree. The mutation labeled B is a size 2 mutation on the (n = 5)-tree, but a size 3 mutation on the (n = 6)-tree. The mutation labeled C is a mutation on a branch extension and is a size 1 mutation on the (n = 6)-tree.