FIG 4.

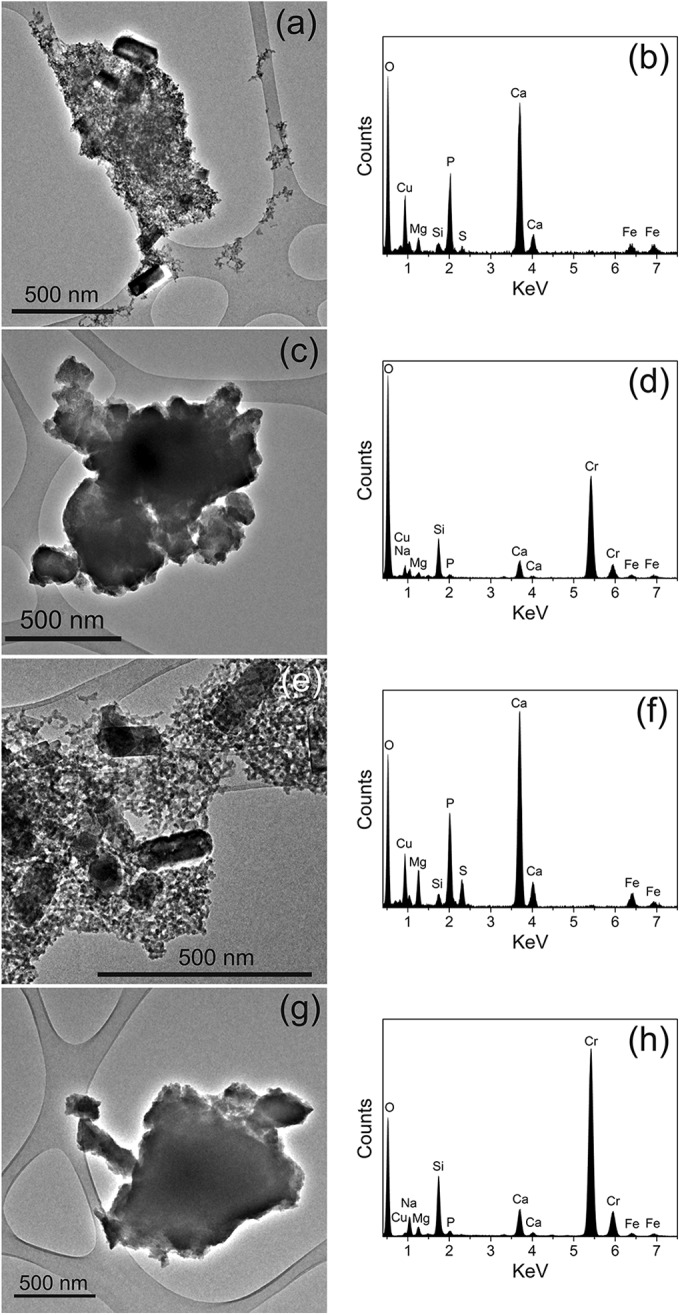
TEM images and their corresponding EDX spectra of Cr-containing solid phases from resting cell experiments at pH 10 (a to d) and pH 11 (e to h). The Cu component in the EDX spectra is due to its presence in the carbon-coated copper grids.

TEM images and their corresponding EDX spectra of Cr-containing solid phases from resting cell experiments at pH 10 (a to d) and pH 11 (e to h). The Cu component in the EDX spectra is due to its presence in the carbon-coated copper grids.