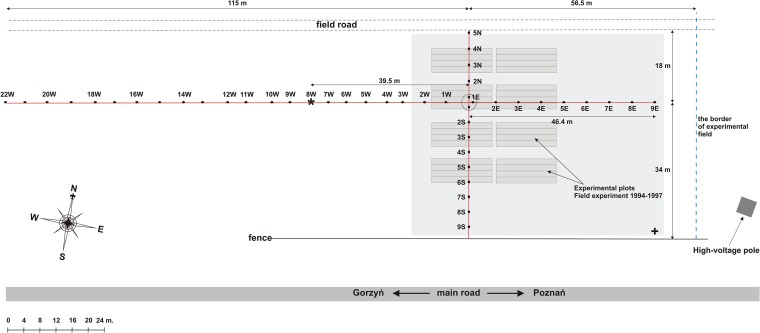
FIG 1.
Design and topography of the field experiment of 2011. A number of plant traps were established in order to determine the distance from the original experimental site (gray squares) within which the nodulation of soybeans occurred. Plant traps were aligned east-west and north-south every 4 to 5 m and are marked with black dots, which are numbered starting from the crossing point (1E, 2E, etc.; 1W, 2W, etc.; 2S, 3N, etc.; and 2S, 3S, etc.). About 10 surface-sterilized seeds were sown in each spot. The area shaded light gray indicates the part of the field where soybeans were sown in 2014. An asterisk (at 8W) marks the westward-most spot where soybean bradyrhizobia were detected. The cross indicates the position of Global Positioning System coordinates, which are 52°33′59.3″N, 15°54′47.8″E.

