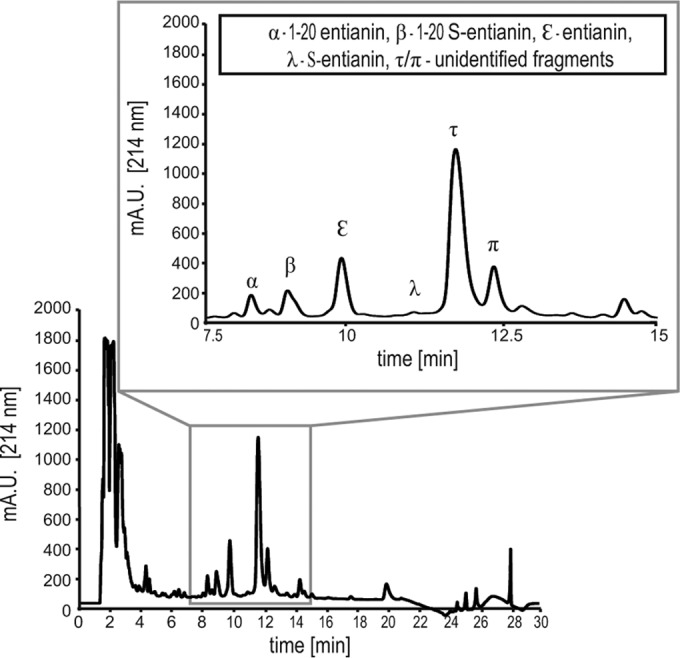
FIG 3.

RP-HPLC chromatogram of 100 μl of supernatant from entianin-producing strain B15029 cultivated in 50 ml of medium A for 30 h, recorded at 214 nm. The zoomed area from 7.5 to 15 min shows the entianin-related peaks (α, entianin1–20; β, S-entianin1–20; ε, entianin; λ, S-entianin). Peaks τ and π eluting behind S-entianin could not be unambiguously identified to contribute to entianin fragments by means of the detected mass/charge (m/z) ratio.
