FIG 2.
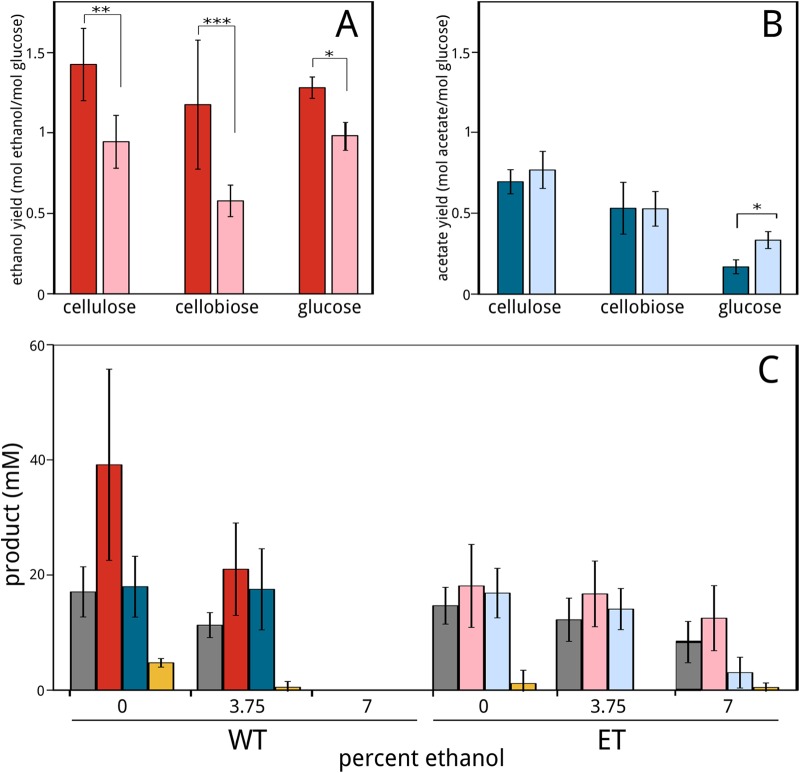
C. phytofermentans yields (mole of product per mole of glucose equivalent consumed) of ethanol from WT (dark red) and ET (light red) strains (A) and acetate from WT (dark blue) and ET (light blue) strains (B). Statistical differences between WT and ET yield averages are indicated at P values of <0.01 (*), <0.05 (**), and <0.1 (***) using Student's t test. (C) C. phytofermentans WT and ET cellobiose consumption and fermentation products in GS2 cellobiose medium with 0, 3.75, or 7% (vol/vol) added ethanol. Bars show concentrations (in millimoles) of cellobiose consumption (gray) and production of ethanol (red), acetate (blue), and formate (yellow) by WT (dark bars) and ET (light bars) strains. All cultures were grown in serum bottles containing GS2 medium at 30°C with 30 g liter−1 cellulose, 10 g liter−1 cellobiose, or 30 g liter−1 glucose and measured after 14 days. Bars represent averages of the results from 4 cultures; error bars represent 1 standard deviation.

