
FIG 5.
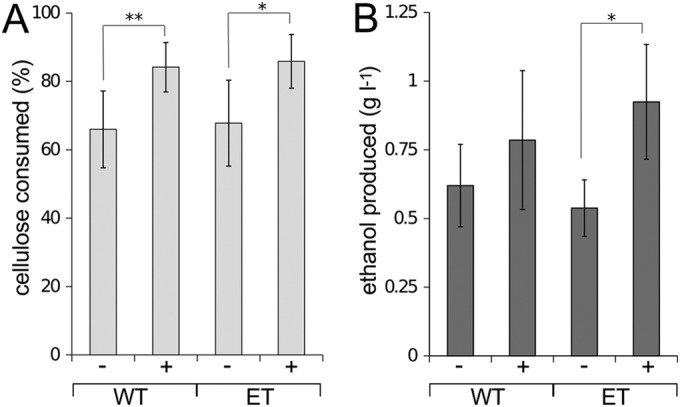
Cellulose consumption (A) and ethanol production (B) by non-plasmid-bearing (−) and pdc-adhB-containing (+) WT and ET cultures at 30°C in GS2 medium with 3 g liter−1 α-cellulose after 30 days. Bars represent averages of the results from duplicate cultures in serum bottles from three independent experiments, and error bars represent 1 standard deviation. Statistical differences between treatments are indicated at P values of <0.01 (*) and <0.05 (**) using Student's t test.