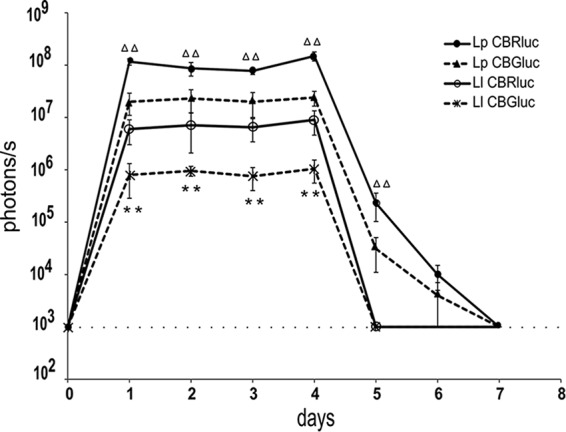
FIG 2.

Persistence of Lc. lactis and Lb. plantarum, both producing CBR and CBG, in mice after oral administration. Plots represent the bioluminescence from day 1 to day 7 from each set of five mice, with standard deviations. The background level for the bioluminescent signal is displayed as a dashed line. Differences between groups were assessed using the Kruskal-Wallis test, and those found to be statistically significant are indicated with triangles for comparison between Lp-CBRluc and Lp-CBGluc (two triangles, P < 0.005) and asterisks for comparison between Ll-CBRluc and Ll-CBGluc (P < 0.005).
