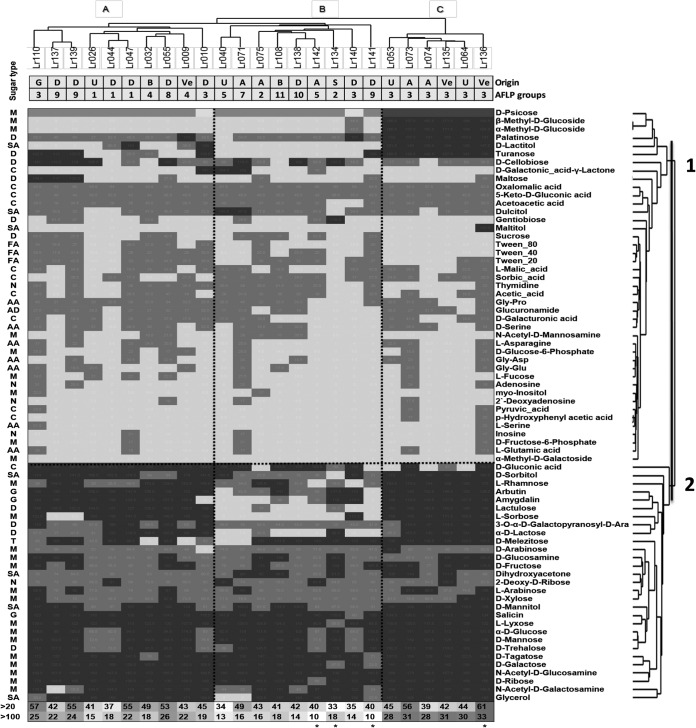
FIG 2.
Heat map and clustering of L. rhamnosus strains and their substrates based on growth endpoint data (Phenotype MicroArray Biolog data) for carbohydrates in clusters 1 and 2. The shading of the heat map refers to the growth level: black, >100 OU; dark gray, 100 to 20 OU; light gray, <20 OU. The two-way clustering of the strains and substrates was created in PAST using the Euclidian distance matrix based on UPGMA clustering. Origins of isolates and AFLP grouping of the strains are displayed below the strain's dendrogram. The origin abbreviations are as follows: A, adult feces; B, baby feces; G, goat feces; D, dairy; S, saliva; Va, vagina; Ve, vegetable; U, unknown. The type of carbohydrate is displayed to the left of the heat map: monosaccharide (M), disaccharide (D), trisaccharide (T), glycoside (G), fatty acid (FA), nucleoside (N), sugar alcohol (SA), carboxylic acid (C), amino acids (AA), and amide (AD). The bottom rows display the numbers of carbohydrates above 20 OU and above 100 OU for each L. rhamnosus strain, and the highest and lowest values are marked with an asterisk.

