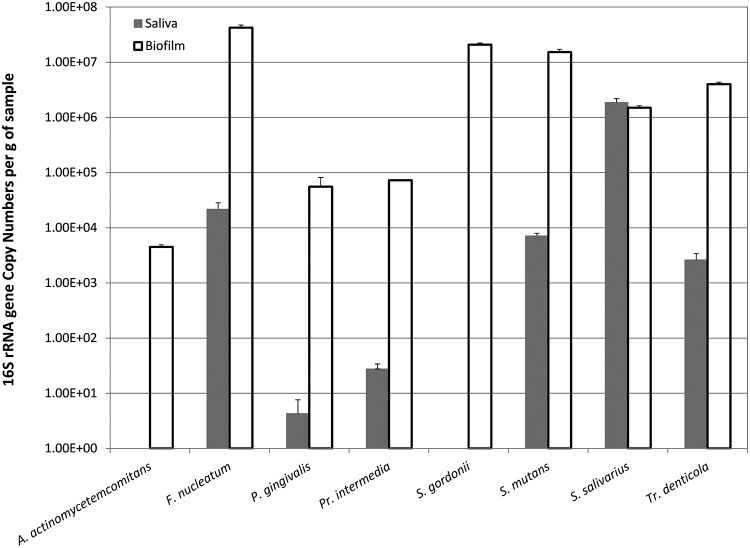
FIG 4.
qPCR analysis. Solid bars show the number of DNA copies found in the saliva samples, whereas open bars show those in the biofilm samples. There were no measureable copies of DNA detected for A. actinomycetemcomitans and S. gordonii in saliva samples. All measured species showed statistical difference between samples, except for S. salivarius.

