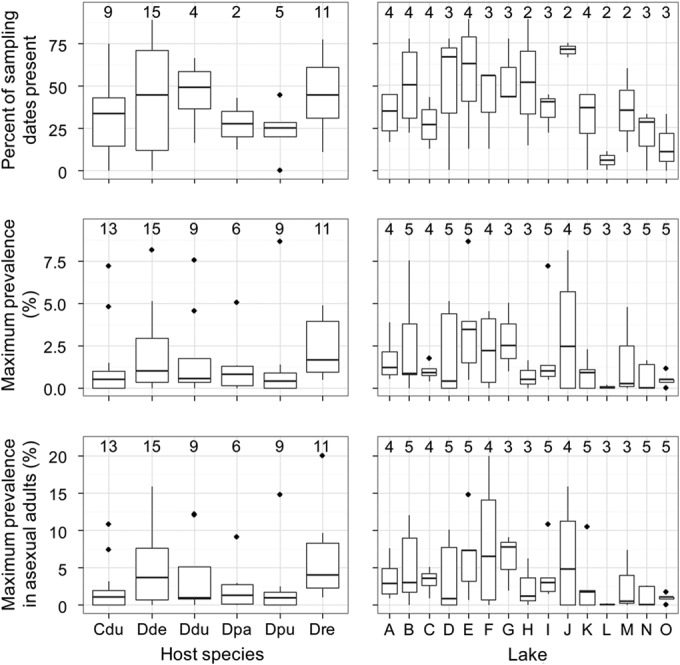
FIG 4.

Abundance of B. paedophthorum in 6 host species (left panels) and 15 lake populations (right panels). The top row shows the percentage of sampling dates on which B. paedophthorum was found in a given host (left panel) or lake (right panel). The center row shows the maximum infection prevalence, and the bottom row shows the maximum infection prevalence in asexual adult females. For the panels on the left, the replicates are the lake populations; for the panels on the right, the replicates are the different host species contained within the lake. The number above the box plot indicates the number of samples summarized by the box; for example, the box plot of maximum prevalence of infection in Ceriodaphnia dubia is based on 13 lakes. Cdu, Ceriodaphnia dubia; Dde, Daphnia dentifera; Ddu, D. dubia; Dpa, D. parvula; Dpu, D. pulicaria; Dre, D. retrocurva; A, Appleton; B, Bishop; C, Bruin; D, Cedar; E, Crooked Pinckney; F, Crooked Waterloo; G, Gosling; H, Little Appleton; I, Mill; J, North; K, Pickerel; L, Sullivan; M, Walsh; N, Whitmore; O, Woodland.
