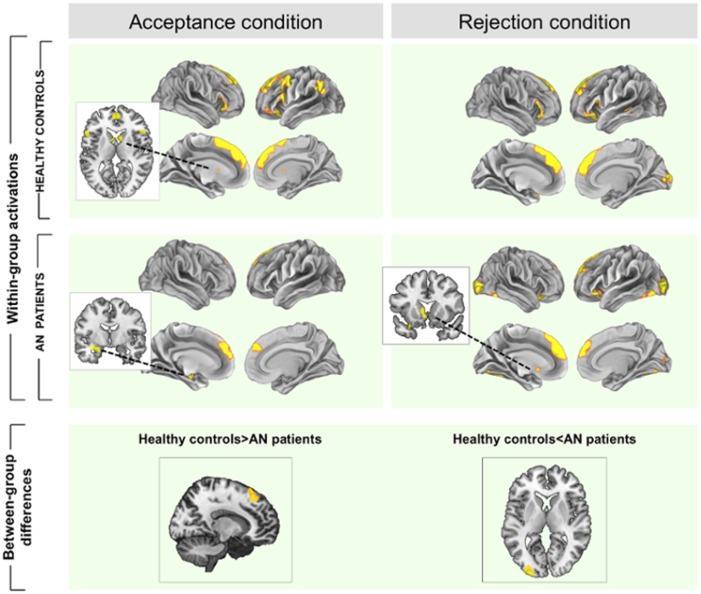
Fig 2. Within and between-group brain activations during acceptance and rejection feedback.
Brain hyperactivations (i.e. contrast acceptance/rejection>control condition) are depicted in yellow and deactivations (i.e. contrast acceptance/rejection<control condition) are in blue. A and B represent within-group activations in A = controls and B = patients. Below, results for the comparison controls>AN patients and for the comparison AN patients>controls. Color bars represents T value, only for between-group comparisons. Images are displayed in neurological convention (left is left).

