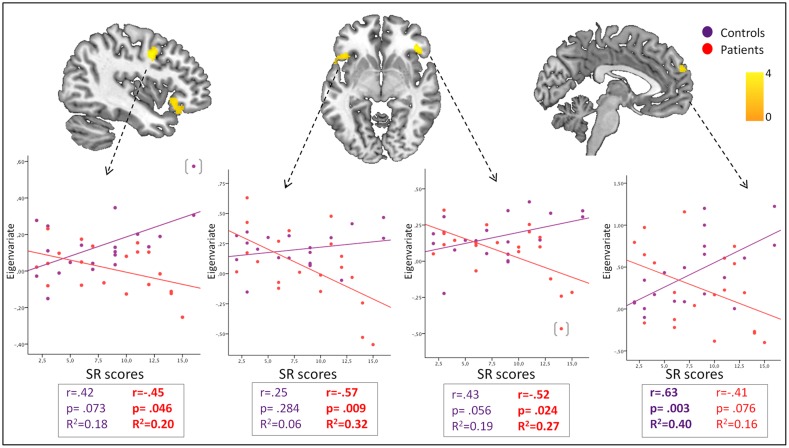
Fig 3. Interactions between Sensitivity to Reward and brain activations during the acceptance condition.
Color bars represents T value. Images are displayed in neurological convention (left is left). Scatter plots represent Pearson's correlations between sensitivity to reward scores and the extracted mean eigenvalues in each relevant cluster: A. Dorsolateral prefrontal cortex. B. Left orbitofrontal-anterior insula cortex. C. Right orbitofrontal-anterior insula cortex. D. Dorsomedial prefrontal cortex. A results table is included, showing peak coordinates of each cluster and their corresponding statistics. (): Two outliers were detected based on the Tukey’s Outlier Filter. Although depicted in the figure, they were removed from correlation analyses.

