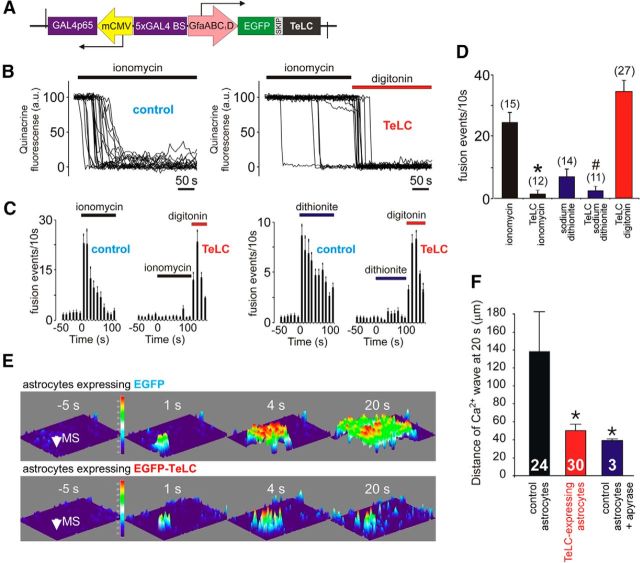
Figure 6.
Blockade of vesicular release mechanisms in astrocytes by virally driven expression of tetanus toxin. A, Schematic of AVV–sGFAP–EGFP–TeLC vector. B, Plots of the TIRF intensity changes showing loss of quinacrine fluorescence from a proportion of labeled organelles in two individual cultured astrocytes transduced to express EGFP (control, left) or TeLC (right) in response to application of a Ca2+ ionophore ionomycin (1 μm). In astrocytes expressing TeLC, digitonin was applied at the end of the experiment to permeabilize the membranes. C, Averaged temporal distribution of ionomycin-induced (left) and sodium dithionite-induced (right) fusion events detected in quinacrine-loaded cultured astrocytes (n = 10 in each group) expressing EGFP or TeLC. D, Summary data illustrating peak frequency of ionomycin- and sodium dithionite-induced fusion events of putative ATP-containing compartments (labeled by quinacrine) detected in cultured astrocytes expressing EGFP (control) or TeLC. *p < 0.001 compared with the rate of fusion induced by ionomycin in control astrocytes. #p = 0.02 compared with the rate of fusion induced by sodium dithionite in control astrocytes. E, TeLC expression inhibits Ca2+ wave propagation induced by mechanical stimulation (MS, indicated by the arrow) in cultured astrocytes. 3D projections of the pixel intensity in the image series obtained before and at indicated time points after mechanical stimulation in astrocyte cultures transduced to express EGFP (top) or EGFP–TeLC (bottom) and loaded with Ca2+ indicator fura-2. F, Bar graph showing the extent of MS-evoked Ca2+ wave propagation (from the point of MS to the front of the wave at 20 s after MS) in control astrocytes, astrocytes expressing TeLC, and naive astrocytes in the presence of the ATP-degrading enzyme apyrase (25 U/ml). Numbers of individual tests are indicated. *p < 0.05.

