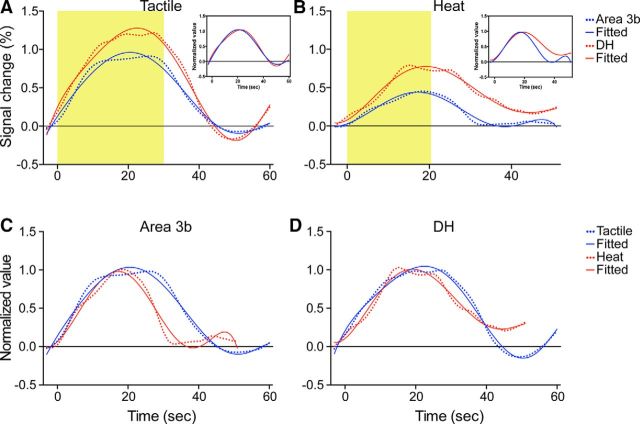
Figure 5.
Comparisons of the HRFs between the spinal DH and somatosensory area 3b (A, B) and heat and tactile (C, D) stimulation. A, B, Mean fMRI time courses (dotted color lines) and the corresponding two gamma fitting curves (solid color lines) in tactile (A) versus nociceptive heat (B) stimulation conditions. Yellow shadows indicate the durations of stimulation. C, D, Normalized and fitted fMRI time courses to tactile (blue lines) versus heat (red lines) stimulation in area 3b (C) and DH (D). Note that the durations for heat and tactile stimuli are different. Area 3b fMRI time courses reported previously (Chen et al., 2007) were used in this comparison.

