
Figure 2.
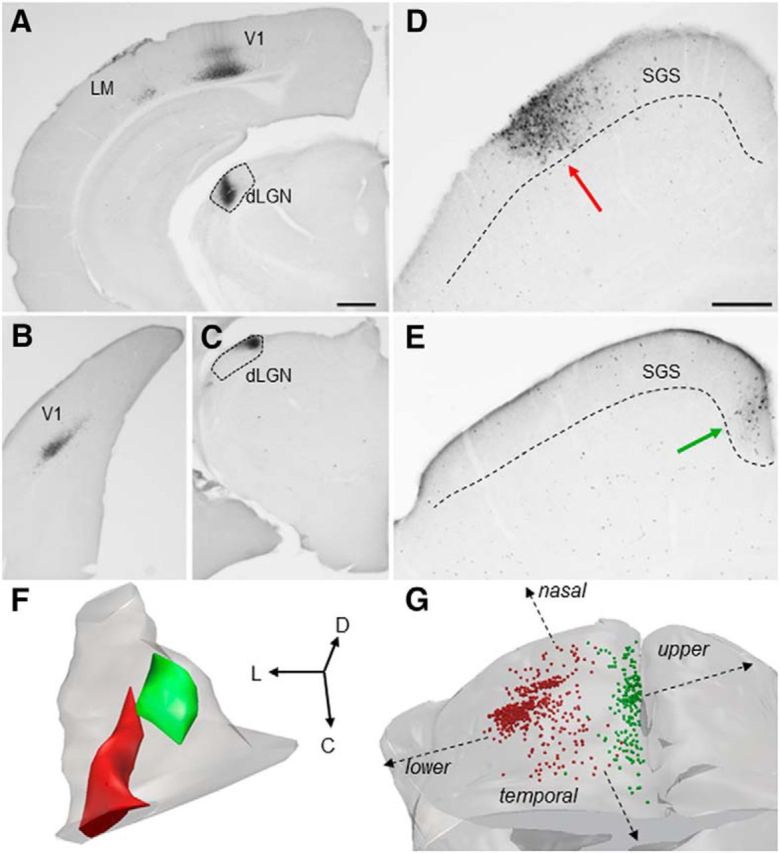
A–G, TG topography. Small iontophoretic injections of CTB in the lateral dLGN (A, coronal section; F, 3D reconstruction of dLGN, red) labeled corticogeniculate cells in layer VI of rostral V1 and the lateromedial (LM) cortex (A) and TG cells in the lateral SGS of the SC (D, coronal section, red arrow; G, 3D distribution, red dots). Small iontophoretic injections of CTB in the medial dLGN (C, coronal section; F, 3D reconstruction of dLGN, green) labeled corticogeniculate cells in layer VI of caudal V1 (B) and TG cells in the medial SGS (E, coronal section, green arrow; G, 3D distribution, green dots). Based on the SC receptive field positions mapped by Dräger and Hubel (1976), TG projections to the medial and lateral dLGN likely represent upper and visual fields, respectively (schematically indicated in G). Scale bars: (in A) A–C, 500 μm; (in D) D, E, 250 μm Orientation of 3D reconstructions in F and G is indicated by arrows. D, Dorsal; L, lateral; C, caudal.