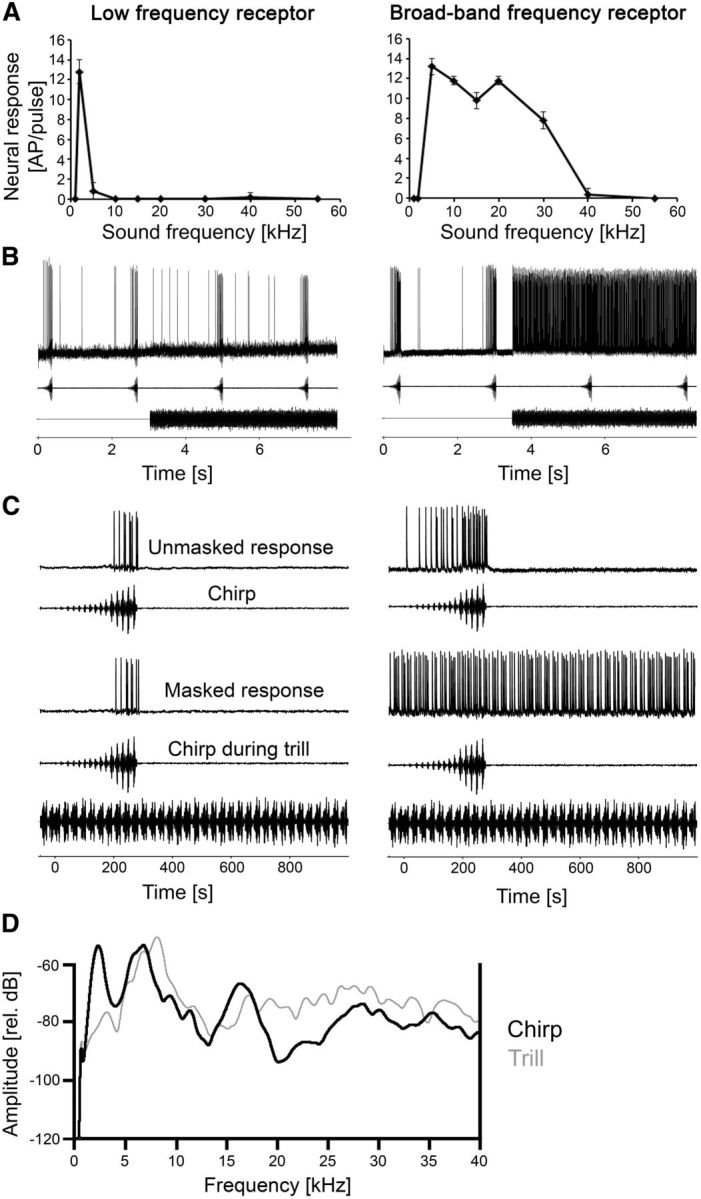
Figure 1.

Frequency tuning and responses of a low-frequency and broadband frequency receptor to a chirp with and without the masking trill. A, Iso-intensity response functions at 80 dB SPL. Error bars show standard deviation (SD) values. B, Recording traces of receptors when the chirp was presented alone and under the masking trill. C, Responses of the same receptors to a chirp without trill (top) and a masked chirp (bottom) at sound intensities of 75 dB SPL. D, Spectrograms of the chirp (black, thick line) and trill (gray, thin line) recorded at the position of the preparation. Note the higher amplitude at 2 kHz in the chirp spectrum.
