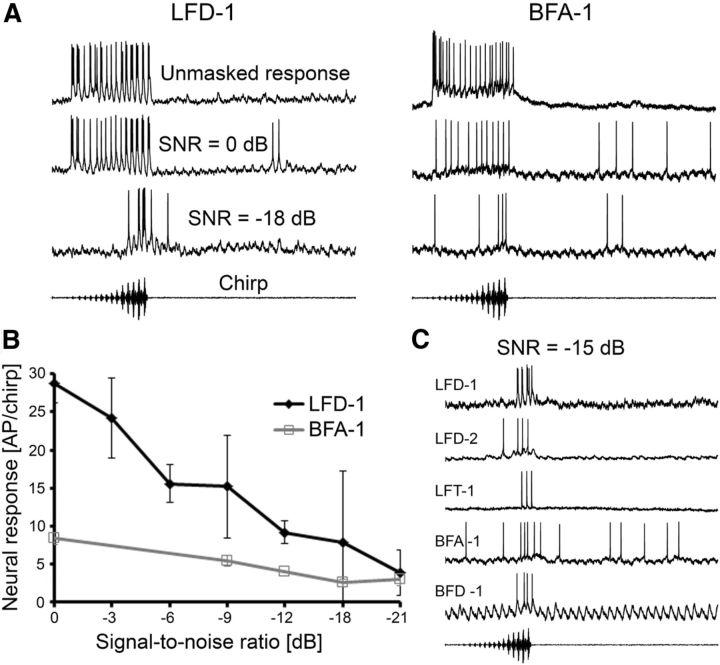
Figure 8.
Responses of LFD-1 and BFA-1 to chirps at different SNRs. A, Representative responses in the unmasked and masked condition at an SNR of 0 dB and −18 dB. B, Average responses at SNRs from 0 dB to −18 dB in one BFA-1 and one LFD-1. Error bars show SD values. C, Representative traces of responses to the masked chirp at an SNR of −15 dB for the three interneurons tuned to 2 kHz, and for BFA-1 and BFD-1.

