
Figure 9.
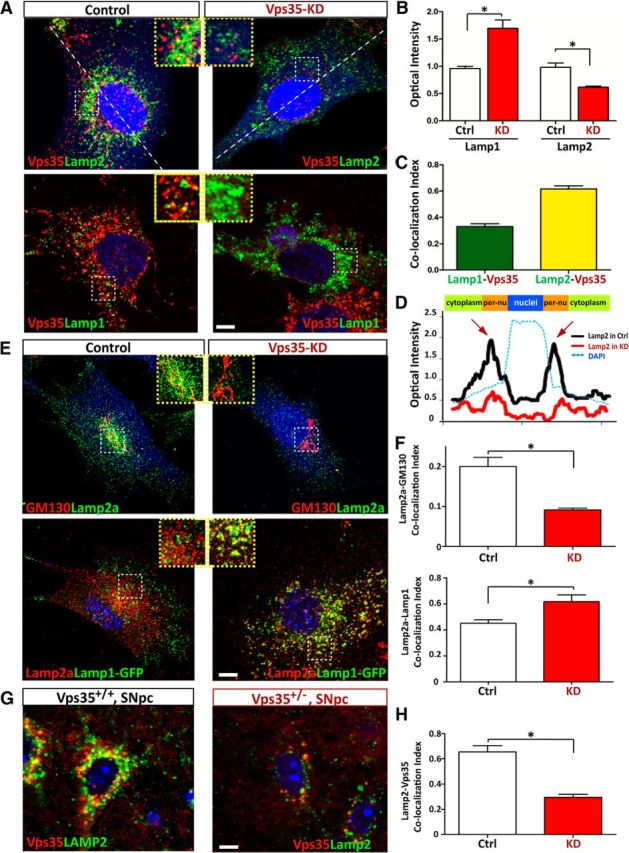
Impaired endosome-to-Golgi retrieval of Lamp2a in VPS35-deficient cells. A–C, Reduction of Lamp2, but increase of Lamp1, in VPS35-deficient NLT cells. NLT cells were transfected with miRNA-VPS35 or scramble control (marked by eBFP) and examined for the distribution of Lamp1/2 and endogenous VPS35. A, Representative images. Scale bar, 10 μm. B, Quantification of Lamp1/2 optical density was presented as mean ± SEM (n = 10; *p <0.05). C, Colocalization index of Lamp1 with VPS35 or Lamp2 with VPS35. D, Altered Lamp2 distribution in VPS35-deficient NLT cells. Line profile intensity of Lamp2a from the dotted line in A was presented. E, F, Coimmunostaining analysis of Lamp2a with endogenous GM130 and exogenous Lamp1-GFP in NLT cells transfected with control or miRNA-VPS35. E, Representative images. Scale bar, 10 μm. F, The colocalization index of Lamp2a with the indicated markers (GM130 and Lamp1) was determined by the measurement of overlapped signal (yellow fluorescence) over total Lamp2a. Data were shown as mean ± SEM (n = 10); *p < 0.01 compared with control cells. G, H, Decreased Lamp2a in DA neurons from 12-month-old VPS35+/− mice. Middle brain sections were immunostained with VPS35 (red) and Lamp2a (green). Scale bar, 5 μm. G, Representative images. Scale bar, 10 μm. H, Colocalization index of Lamp2 with VPS35. Ctrl, Control; KD, knockdown.